YouTube's Stats for Nerds is a real-time playback diagnostic overlay. It helps explain buffering, quality drops, dropped frames, codec behavior, and whether the player is receiving enough data for the selected resolution.
Quick Answer: What Stats for Nerds Shows
YouTube Stats for Nerds shows the technical playback data behind the video you are watching. The most useful fields are current/optimal resolution, viewport, dropped frames, connection speed, network activity, buffer health, codec, and volume normalization. If the video looks blurry, compare current resolution with optimal resolution. If it stutters, check dropped frames and buffer health. If it buffers, look at connection speed and network activity.
To turn it on, right-click a YouTube video on desktop and choose Stats for nerds. On mobile or TV, open the video settings menu when the option is available. The panel is diagnostic only; it is separate from YouTube Studio analytics and does not show channel growth metrics.
| Stats for Nerds metric | What to check first |
|---|---|
| Current / Optimal Res | Whether YouTube is serving the quality your screen can display. |
| Dropped Frames | Whether your device is failing to render frames smoothly. |
| Connection Speed | Whether bandwidth is stable enough for the selected quality. |
| Buffer Health | Whether enough video is preloaded to avoid pauses. |
| Codecs | Whether the stream uses a codec your device handles well. |
Your Video's Technical X-Ray

This is a point of confusion for a lot of creators, but the difference is crucial. This little panel has absolutely nothing to do with your views, subscriber count, or audience retention.
Its sole purpose is to help viewers and creators figure out what’s going wrong with playback. Is that annoying buffering wheel spinning because of your Wi-Fi, or is there a bigger problem with YouTube’s servers or how the video was encoded? Stats for Nerds gives you the data to find out.
That distinction matters because creators often mix up two completely different dashboards. Stats for Nerds helps you diagnose playback quality on one video session. YouTube Analytics helps you understand audience behavior across your channel. If a viewer says a video is lagging, Stats for Nerds can show whether the issue is resolution, dropped frames, or network buffering. If a video is underperforming, YouTube Analytics is where you look for retention, traffic source, and click-through-rate patterns.
Stats for Nerds vs. YouTube Analytics
To make the distinction crystal clear, let's compare Stats for Nerds directly with the tool creators live in every day: YouTube Analytics. One is for diagnosing technical problems in the moment; the other is for analyzing audience behavior over time.
For a deeper look into the audience side of things, check out our complete guide to YouTube Analytics.
The core function of Stats for Nerds is troubleshooting. It turns vague complaints like "the video is lagging" into actionable data points you can use to identify the root cause of playback failures.
Here’s a simple breakdown comparing these two very different YouTube tools.
Stats for Nerds vs YouTube Analytics at a Glance
| Feature | Primary User | Data Type | Main Purpose |
|---|---|---|---|
| Stats for Nerds | Viewers & Creators | Real-time technical | Diagnosing streaming issues like buffering & quality |
| YouTube Analytics | Creators & Marketers | Historical audience | Analyzing channel growth, views, & demographics |
As you can see, they serve completely different masters. One is for the engineer, and the other is for the strategist. Now, let's get into what all those nerdy stats actually mean.
How to Open Stats for Nerds on Any Device
Alright, let's get our hands dirty. Before you can start playing playback detective and figuring out what’s really going on with your stream, you need to open the Stats for Nerds panel. It’s your secret weapon for turning vague streaming frustrations into cold, hard data.
Thankfully, YouTube has made this tool pretty easy to find, though the steps are a little different depending on where you’re watching.
On a Desktop Browser
If you're on a laptop or desktop computer using a browser like Chrome, Safari, or Firefox, this is the easiest way. It's almost comically simple.
Just right-click anywhere on the video player itself. You don't need to dig through settings or menus. A little box will pop up, and you'll see "Stats for nerds" right there. Click it, and you're in.
On Mobile and TV
Things are a bit more tucked away on your phone or TV, but it's still a quick process once you know where to look.
On an iPhone or Android device, you'll need to pop open the settings inside the YouTube app while a video is playing.
- Tap the little gear icon to open the video settings panel.
- From there, tap on "Advanced settings" at the bottom of the list.
- You should see a toggle switch for "Stats for nerds." Just tap it to turn on the overlay.
Here’s exactly what that menu looks like inside the YouTube mobile app, so you know what you're hunting for.
As you can see, it's just a simple toggle once you navigate to the right spot.
For smart TVs and streaming boxes like Apple TV, Roku, or your Chromecast, the path is usually pretty similar to mobile. While a video is playing, look for the settings or "more options" menu. You’ll typically find an option labeled "Stats" or "Stats for Nerds" that you can select to bring up that transparent data panel on your screen.
And that's it! In just a few clicks, you can start diagnosing what's happening behind the scenes.
Understanding Every Metric on the Stats Panel
Popping open the Stats for Nerds panel for the first time can feel like looking at the cockpit of a spaceship—a wall of blinking numbers and cryptic codes. But once you know how to read the dashboard, you gain a massive amount of control over your streaming experience. Let's break down this technical jargon into plain English, one line at a time.
Each metric is a clue to your video stream's health. Think of yourself as a detective trying to solve a playback mystery; these stats are your evidence. We'll start with the basics and move through each piece of the puzzle.
First, here's a quick look at how you can pull up this powerful tool on your favorite devices.
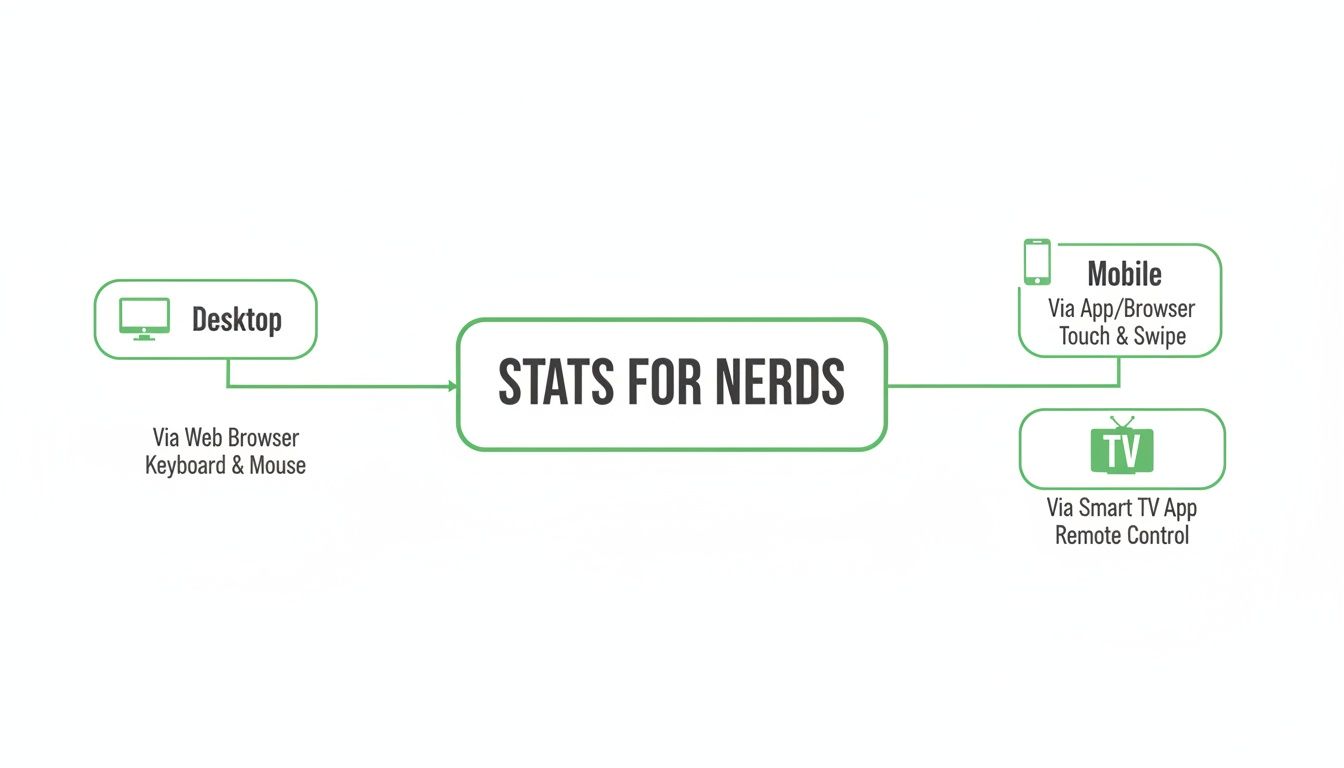
As you can see, it's pretty straightforward to enable the stats overlay, whether you're on a computer, phone, or smart TV.
Now, let's dive into what all of those numbers actually mean.
Key Stats for Nerds Metrics Explained
The data in the Stats for Nerds panel can tell you everything from the video's unique ID to the health of your internet connection's video buffer. The table below breaks down the most critical metrics you'll encounter.
| Metric | What It Means | Good Sign | Bad Sign (Potential Issue) |
|---|---|---|---|
| Video ID / sCPN | The Video ID is the unique identifier for the video itself. The sCPN is a unique code for your specific viewing session. | Having this info ready for support tickets. | N/A - This is purely for identification. |
| Viewport / Dropped Frames | Viewport is your player's size in pixels. Dropped Frames shows how many frames your device failed to display (first number) out of the total played (second number). | 0 dropped frames. | A steadily increasing number of dropped frames, causing stuttering. |
| Current / Optimal Res | The resolution you're actually watching (Current) versus the best resolution for your current player size (Optimal). | Current resolution matches Optimal resolution, or is intentionally set higher (e.g., 4K on a 1080p screen). | Current resolution is much lower than Optimal, indicating a network issue or manual quality reduction. |
| Codecs | The compression "language" of the video and audio streams. vp09 and avc1 are common video codecs, while opus and mp4a are for audio. | Your device supports modern codecs like vp09 for better efficiency. | N/A - but knowing the codec can help diagnose device-specific playback issues. |
| Connection Speed | An estimate of your current bandwidth in Megabits per second (Mbps). This is how fast video data is being downloaded. | A stable speed well above the bitrate needed for your chosen resolution (e.g., 20-30 Mbps for 4K). | Fluctuating or low speeds that cause buffering. |
| Buffer Health | The amount of video, in seconds, that is pre-loaded and ready to play on your device. Think of it as a safety net. | A healthy buffer of 30-60 seconds. | A buffer that is dropping towards 0 seconds, which will trigger the spinning wheel. |
| Network Activity | Shows the amount of data (in Kilobytes) currently being transferred. A "K" next to the number means it's currently downloading video data. | A steady number with a "K" when the buffer is filling. It will go to zero when the buffer is full. | A "K" that is constantly present and a buffer that isn't growing, indicating a slow connection. |
Understanding these individual metrics is the first step. Next, you can start connecting the dots between them to diagnose exactly what's going wrong when a video starts acting up. For example, if you see Dropped Frames increasing while your Connection Speed is high, the problem is likely your computer's hardware, not your internet.
How to Troubleshoot Buffering and Quality Issues
Knowing what all those stats mean is half the battle. The other half is actually using them to fix the real-world headaches that pop up during playback. Think of the Stats for Nerds panel as your secret decoder ring for turning vague complaints into data you can actually use.
It helps you pinpoint exactly where a stream is breaking down. Whether you’re a viewer sick of staring at the buffering wheel or a creator getting comments about "laggy video," this data gives you the clues you need to stop guessing and start diagnosing.
Opening the panel is only the first step. The useful part is matching a visible symptom to the relevant field: buffer health for pauses, dropped frames for stutter, and current versus optimal resolution for unexpected quality changes.
Common Scenarios and Quick Fixes for Viewers
If you’re the one stuck with a choppy stream, the stats panel can point you right to the culprit. No more random guessing—just cold, hard data.
-
Problem: High Dropped Frames So, the first number in Dropped Frames is climbing like a rocket, but your Connection Speed looks totally fine? That’s a classic sign your device is the bottleneck. Your computer’s hardware is struggling to keep up and render the video smoothly.
- Solution: Start by closing other resource-hungry apps and browser tabs. If that doesn't work, try updating your graphics card drivers or toggling the hardware acceleration setting in your browser.
-
Problem: Low Buffer Health Is your Buffer Health constantly stuck near zero? This is the textbook definition of a network problem. Your connection just can't feed the video player data fast enough to stay ahead.
- Solution: Pop open a speed test tool to confirm your internet speed. If it's slow, the usual tricks often work: restart your router, cozy up closer to your Wi-Fi signal, or—the gold standard—ditch Wi-Fi for a stable, wired Ethernet connection.
A Creator's Guide to Diagnosing Viewer Complaints
For creators, Stats for Nerds is your first line of defense. When a viewer complains about buffering, asking them for a screenshot of their stats panel can save you from a world of frustration and guesswork.
The sCPN (session client playback nonce) is a golden ticket. It's a unique ID for that specific viewing session. When a viewer sends a screenshot with the sCPN, you (or even YouTube support) have a specific data point to investigate, which is incredibly useful for tracking down widespread issues.
With that one screenshot, a generic complaint like "your video is broken" transforms into a specific, data-rich report. You can see right away if the problem is on their end (like a weak Connection Speed), your end (maybe a bad encode), or a broader YouTube platform issue. Digging into this technical data is a crucial part of refining your post-production workflow.
Let's say multiple viewers on different networks all report issues, and their stats show problems with a particular Codec (like vp09). That's a huge red flag pointing to a potential problem with how your video was processed on upload. Armed with that knowledge, you can make an informed call on whether to re-encode and re-upload, ensuring everyone else has a smooth experience.
To get a better handle on the numbers that really matter, take a look at our deeper dive into essential video performance metrics.
Connecting Playback Quality to Content Strategy
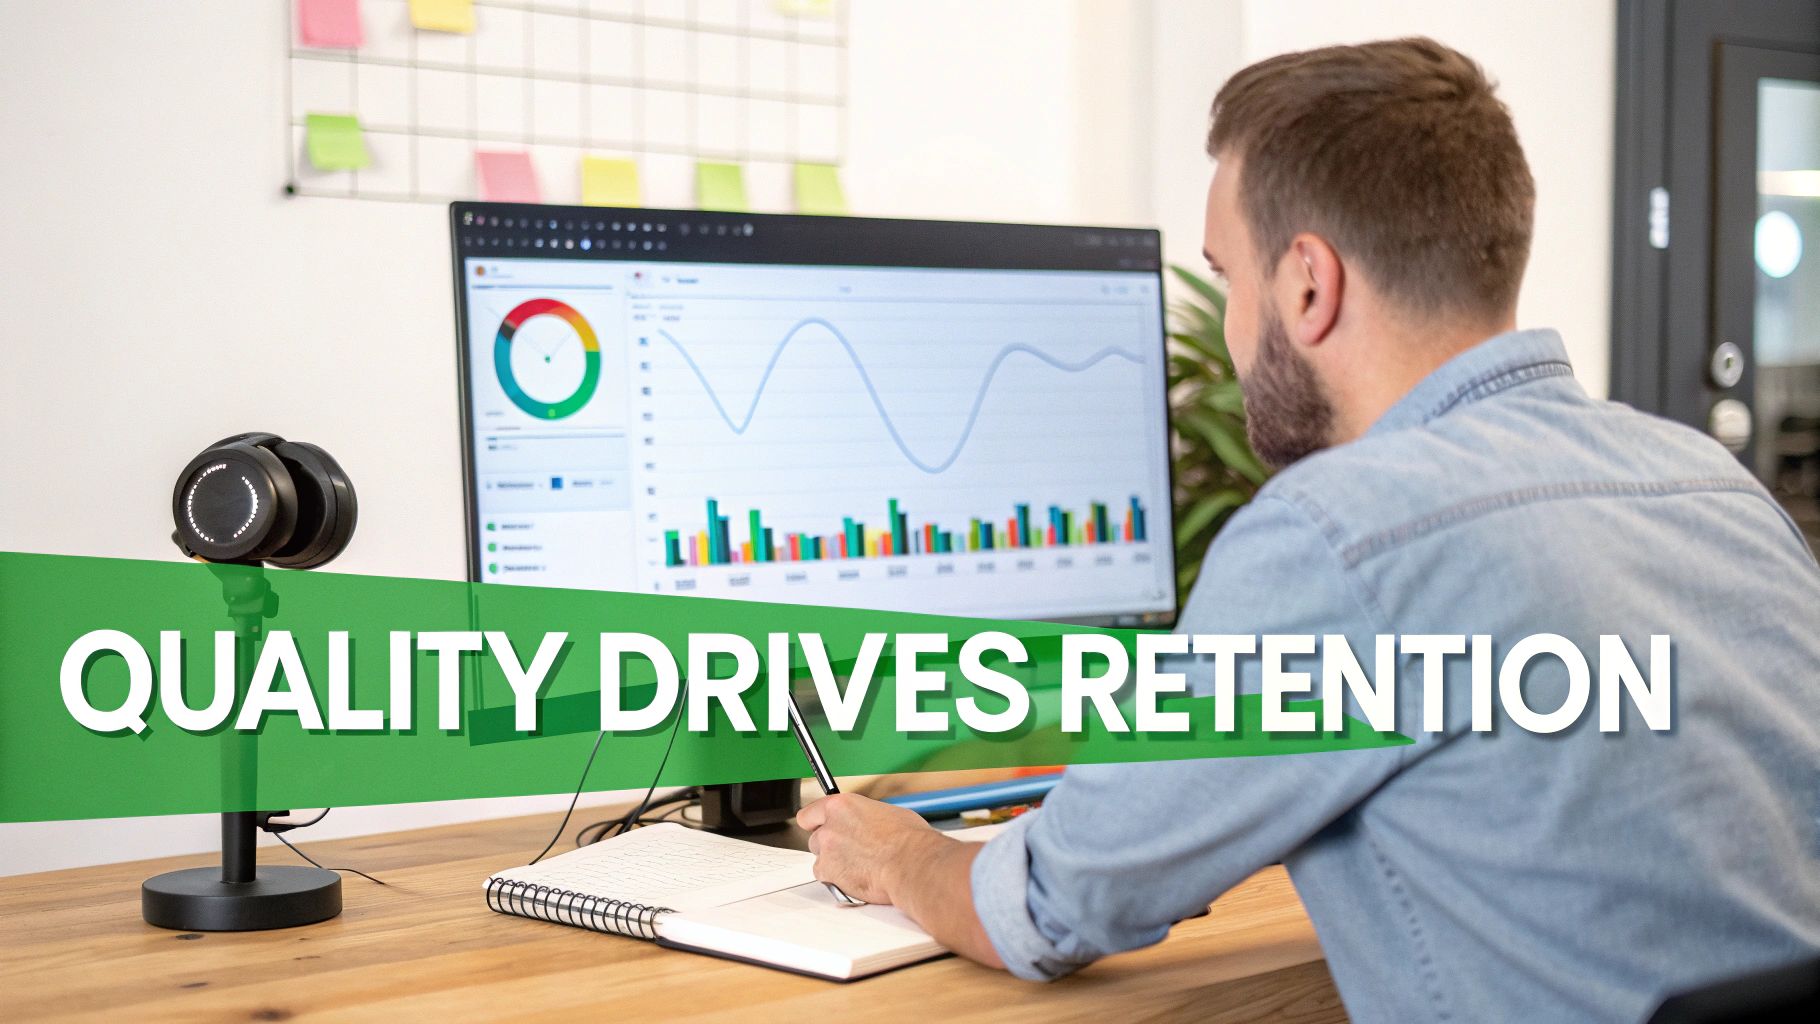
It’s easy to think of technical details as something for the IT crowd, but they're actually a huge piece of a winning content strategy. The numbers you find in stats for nerds draw a straight line between your stream’s quality and your audience’s attention span.
Think about it: every dropped frame, every second of buffering—it all wears down a viewer's patience.
A frustrated viewer is a lost viewer. This is especially damaging for long-form content like podcasts or in-depth tutorials, where someone is settling in for a while. If they have to constantly fight with a stuttering stream, they’ll just click away, no matter how good your content is.
That's a direct hit to your most important metrics. A poor playback experience is one of the fastest ways to tank your viewer retention, which tells the YouTube algorithm that your content just isn't cutting it.
Proactive Choices for Smoother Streams
The good news is you can get way ahead of these problems by being smart during your upload and encoding process. Using the right settings isn’t just about making the video look good; it’s about making sure it can be delivered smoothly to as many people as possible, even those on a spotty connection.
Here are the fundamentals to lock down:
- Optimal Encoding Settings: Picking the right codec and container makes a world of difference in how efficiently YouTube can process and serve your video.
- Sensible Bitrates: Pushing for the absolute highest bitrate isn't always the answer. A balanced bitrate delivers fantastic quality without demanding too much from your viewer's internet connection.
- Resolution Management: When you upload a high-quality source file in 1440p or 4K, you give YouTube the best possible material to create all its different playback versions.
The bottom line is this: delivering a flawless technical experience is just as crucial as the content itself if you want to grow your channel. A solid technical foundation is what great storytelling is built on.
The panel is most useful when you capture it during the problem and compare the fields over time. A single screenshot after playback recovers may miss the network or rendering change that caused the issue.
Turning Technical Data into Audience Growth
At the end of the day, digging into these technical metrics helps you sharpen your entire approach. When you proactively tackle potential playback issues, you’re building a more reliable and enjoyable experience for your audience. That trust pays off in longer watch sessions and a more loyal subscriber base.
When viewers know your stream is going to be smooth, they're far more likely to stick around. This improved engagement is a critical factor in how you can increase your YouTube watch time and signal to the algorithm that you're putting out quality content.
Getting comfortable with the data from stats for nerds helps you build this foundation of trust. It’s how you turn nerdy insights into real success, ensuring your content performs just as well on a technical level as it does creatively. This is the kind of holistic approach you need to effectively monetize your YouTube Shorts and build a channel that lasts.
Common Questions About Stats for Nerds
Even after breaking down all the metrics, a few questions always seem to pop up. It’s a powerful diagnostic tool, but it can feel a little dense at first. Let's clear up some of the most common points of confusion.
Think of this as your quick-reference guide. By the end, you'll be using the Stats for Nerds panel with confidence, whether you're just a curious viewer or a creator hunting down a technical gremlin.
Can Other People See My Stats for Nerds Data?
Absolutely not. The stats you see are 100% private to your specific viewing session on your device. It’s a live snapshot of the connection between your machine and YouTube's servers at that very moment.
The only way anyone else can see your data is if you take a screenshot and send it to them. This is exactly why creators or support teams ask for one when you report a problem—it’s the only window they have into your technical experience.
Does This Replace My YouTube Studio Analytics?
This is a critical distinction to make. Stats for Nerds and YouTube Analytics are two completely different toolkits designed for two completely different jobs. They don't replace each other; they work together.
- YouTube Studio Analytics is all about strategy. It tells you about your audience’s behavior over time—who is watching, for how long, and where they came from. It answers the "who" and "why."
- Stats for Nerds is purely for diagnostics. It reveals the real-time technical performance of the video stream itself, like buffering, resolution, and connection speed. It answers the "how" and "what's wrong."
Think of it like owning a car. Analytics is your dashboard, showing your trip distance and fuel economy. Stats for Nerds is the diagnostic report a mechanic pulls when the engine starts sputtering.
You use Analytics to understand your content's performance and Stats for Nerds to ensure that content is being delivered without a technical breakdown. Both are essential for a healthy channel.
Why Does My Optimal Res Differ from My Video Quality?
Ever selected 4K quality but see an Optimal Res of 1080p? It’s not a bug. The "Optimal Res" is what YouTube calculates as the best possible resolution your current browser window size can physically display.
For example, if you're watching a 4K video in a small, non-fullscreen window, that little player simply doesn't have enough pixels to render the full 4K image. In that case, 1080p is the most efficient and truly "optimal" resolution for that viewport. The moment you go fullscreen, you'll see the Optimal Res jump up to match your monitor's true capability.
What Should I Do If My Dropped Frames Are High?
A steadily climbing Dropped Frames count is almost always a sign that your local hardware is struggling, not your internet connection. Your device is simply failing to render the video frames fast enough to keep up.
The first thing to try is reducing the load on your system. Close out other demanding programs and any browser tabs you don't need. If the problem hangs around, updating your computer's graphics drivers or disabling hardware acceleration in your browser's settings are common and surprisingly effective fixes.
Stats for Nerds diagnoses playback; it does not create or analyze chapters. If you need a draft of timestamped navigation for a long upload, try TimeSkip's YouTube chapter generator and review the labels before publishing.