Let’s get one thing straight: YouTube Analytics isn't just a bunch of charts and numbers. It's the story of your channel, told directly by your viewers. It reveals who is watching, how they're finding your videos, and what actually keeps them hooked. Think of it as a direct line to your audience, turning random creative choices into a focused plan for growth.
Why YouTube Analytics Is Your Growth Compass
Trying to grow a YouTube channel without checking your analytics is like sailing across an ocean with no map. You might be putting out amazing content, but you're essentially just drifting, hoping to land somewhere good. YouTube Analytics is the compass that turns you from a creator who's just guessing into a strategist who knows their next move. It’s absolutely essential for any kind of sustainable growth.
It helps you understand the why behind your views. For example, instead of just celebrating that a video hit 1,000 views, you can dig in and see that 70% of those views came directly from YouTube search. That's a game-changing insight. It tells you your keyword strategy is hitting the mark and that you should probably explore that topic even further.
From Raw Data to Real Decisions
The real magic of analytics isn't just about staring at impressive numbers; it's about connecting the dots and understanding the little details that drive those big results. This is where you move past simple vanity metrics and start making decisions that actually move the needle.
It gives you a crystal-clear window into how your audience behaves. YouTube is a massive platform with over 2.5 billion monthly active users, so knowing exactly who your slice of that audience is and what they want is everything.
When you first open YouTube Studio, you're greeted with the main dashboard, which offers a quick health check of your channel.
This snapshot immediately gives you the vital signs: your current subscriber count, a summary of recent views, total watch time, and your estimated revenue. It's the perfect starting point before you dive deeper.
The Four Pillars of YouTube Analytics
To keep things from getting overwhelming, YouTube organizes its analytics into four main tabs. Each one is designed to answer a different core question about your channel's performance. Getting comfortable with these four areas is the first step toward building a data-driven content strategy.
Key Insight: Don’t treat analytics like a report card you glance at once a month. Think of it as a living, breathing conversation with your audience. The data is constantly telling you what they love, what bores them, and what they want you to create next.
To make this easier, I've put together a quick table that breaks down these core dashboard areas and the questions they help you answer.
Core YouTube Analytics Dashboard Areas
| Dashboard Tab | What It Tells You | Key Questions Answered |
|---|---|---|
| Reach | How people are discovering your channel and videos across the platform. | "Where are viewers finding me?" "Are my thumbnails effective?" "Which traffic sources are most valuable?" |
| Engagement | How much time viewers spend watching your content and how they interact. | "Are people actually enjoying my videos?" "Where do viewers drop off?" "Which videos keep people watching the longest?" |
| Audience | The demographics and viewing habits of the people who watch your channel. | "Who is my typical viewer?" "What other videos do they watch?" "When is the best time for me to post?" |
| Revenue | A detailed breakdown of your channel's earnings (for monetized channels). | "How much money am I making?" "Which videos are my top earners?" "What are my main revenue sources?" |
By regularly checking in on these four pillars, you'll start to see your channel not just as a collection of videos, but as a system you can understand, tweak, and grow with confidence.
Decoding Your Key Reach Metrics

If your engagement metrics are the heart of your channel, then think of your Reach metrics as the circulatory system. This is all about how your videos actually get delivered to viewers across the massive YouTube ecosystem. Getting a handle on this data is the first real step to figuring out why one video blows up while another one fizzles out.
Essentially, the Reach tab tells you the story of how your videos find an audience. It’s less about what happens in the video and more about how people even get there to begin with.
The Story of Impressions vs. Views
Let's start with a simple analogy. Think of Impressions as window shopping. It's the total count of how many times your video's thumbnail was shown to someone on YouTube—whether it popped up on their homepage, in a search result, or as a suggested video. Each impression is an opportunity for a click.
A View, on the other hand, is when that window shopper decides to walk into your store. YouTube counts a view when someone deliberately clicks your thumbnail to watch the video. The difference is potential versus action. It’s the gap between how many people could have watched and how many actually did.
This is a huge deal. If your impressions are sky-high but your views are disappointingly low, it’s a massive red flag that your packaging—your thumbnail and title—isn't doing its job.
Click-Through Rate: The First Impression
This brings us directly to Impressions click-through rate (CTR), which is arguably the most critical metric in the entire Reach tab. CTR is simply the percentage of those impressions that successfully turned into a view. It’s a direct measurement of how effective your video’s "first impression" really is.
A high CTR sends a powerful signal to the YouTube algorithm. It says, "Hey, people who see this thumbnail and title really want to watch this video," which encourages YouTube to show it to even more people.
So, what's a "good" CTR? Honestly, it varies a lot by niche and topic. But as a general rule of thumb, most channels should aim for something between 4% and 5%. If you're consistently hitting 6% or higher, you're doing great. And if you see anything over 10%, especially on a video with a lot of impressions, you've really hit a home run.
Uncovering Your Traffic Sources
Finally, we have the Traffic sources report. This is your treasure map. It shows you the exact paths people took to find your content, breaking down where your viewers are coming from. If you want to double down on what’s working, this is where you need to look.
Here are the main sources you’ll see and what they mean for you:
- YouTube Search: People found you by typing keywords into the search bar. This is a clear sign that your video SEO is on point.
- Suggested Videos: Your video popped up next to or after another video. This is gold. It means YouTube's algorithm sees your content as a perfect follow-up for viewers.
- Browse Features: These are views from the YouTube homepage, the subscription feed, and other discovery pages. When this number is high, it means YouTube is actively recommending your channel to people it thinks will love your stuff.
- External: A viewer clicked a link from another website, a social media post, or an embedded player on a blog. This tells you how effective your promotion efforts are outside of YouTube itself.
By digging into which sources are driving the most views—and more importantly, the highest-quality watch time—you can start making smart, strategic decisions. If Search is your top performer, you know to lean into keyword research. If Suggested is bringing in the crowds, you can analyze which specific videos are sending viewers your way and make more content like that. This is how you turn a simple YouTube analytics explained guide into a real, actionable growth plan.
Getting a Grip on the Engagement Metrics That Really Matter

Alright, so your Reach metrics show you how people are stumbling upon your videos. But the Engagement metrics? That's where you find out if they actually liked what they found. This is the real pulse of your channel. Strong engagement is your direct line to the YouTube algorithm, telling it loud and clear that your content is hitting the mark and satisfying viewers.
For a second, let's forget about raw view counts. On YouTube, attention is the real currency. The platform's entire business model is built on keeping people on the site for as long as possible, and it showers rewards on creators who help them do just that.
Watch Time: The Undisputed King
Out of all the data swimming around in your YouTube Studio, Watch Time wears the crown. This isn't just a count of views; it's the total, cumulative minutes and hours people have spent glued to your videos. It’s a far more potent signal of a video's quality than views alone because it measures genuine interest, not just a fleeting click.
Think of it this way: a one-minute view on your ten-minute video doesn't mean much. But if you can consistently get people to stick around for eight or nine minutes, you're giving the algorithm exactly what it craves—proof that your content holds attention. This is a foundational concept.
Key Takeaway: YouTube doesn't just want clicks; it wants satisfaction. High Watch Time is the most powerful evidence you can provide that your videos are making viewers happy, which in turn makes it a crucial factor in getting your content recommended to new audiences.
This is why you'll often see a video with fewer views but incredible watch time outperform a viral hit that people click away from in seconds. It’s all about quality of viewership, not just quantity.
How to Read the Audience Retention Graph
If Watch Time is the final grade on your report card, then the Audience Retention graph is the detailed, line-by-line feedback from your teacher. This graph is your secret weapon for making better videos, period. It shows you, second-by-second, what percentage of your audience is still watching.
Learning to decipher this graph is like unlocking a superpower. You can see exactly where people are hooked and, more importantly, where their interest drops and they leave.
- Intros: Pay close attention to the first 15-30 seconds. A massive nosedive here is a red flag that your hook is weak or that the video isn't delivering on the promise of your title and thumbnail.
- Spikes: See a little bump in the graph? That's gold. It's a re-watch point, meaning viewers are rewinding to catch that part again. It could be a key piece of information or a really funny joke. Figure out what it is and do more of it.
- Dips: A gradual slide or a sharp cliff shows you where you're losing the crowd. Was it a long, rambling story? A confusing point? An awkward cut? This is your roadmap for what to tighten up or remove next time.
- Flat Lines: The dream scenario is a high, flat plateau. This means you've captivated your audience and they're sticking with you through that entire section.
This graph is directly tied to the first impression your video makes. A fantastic thumbnail might earn the click, but it's the content's ability to hold that viewer's attention that truly counts. For a deeper dive, it's worth exploring how a great https://timeskip.io/blog/youtube-click-through-rate and strong retention work hand-in-hand to fuel growth.
Likes, Comments, and Shares
While Watch Time is the main event, don't discount the other engagement signals. Some people dismiss these as "vanity metrics," but they still play a key part in building social proof and fostering a community.
- Likes: A quick and easy thumbs-up. It's a low-effort signal to both the algorithm and other viewers that the content is worth watching.
- Comments: This is the ultimate sign of a healthy community. A lively comment section shows your video was compelling enough to make someone stop and type out a reaction. If you're struggling to get the ball rolling, a YouTube comment generator can sometimes help spark those initial conversations.
- Shares: When someone shares your video, they're putting their own reputation on the line to recommend it. This is one of the strongest endorsements you can get and a fantastic way to drive traffic from outside of YouTube.
Building a Profile of Your Ideal Viewer

So, your Reach and Engagement metrics tell you what your viewers are doing. But the Audience tab? This is where you find out who they are. This is where you can stop guessing and start building a concrete picture of the people watching your videos.
Think of it like running a coffee shop. You wouldn't just randomly stock beans and pastries, right? You’d get to know your regulars. The Audience tab is your way of getting to know the people who keep coming back to your channel.
Uncovering Core Demographics
Your first stop here should be the basic demographics: age, gender, and top geographies. This isn't just a list of stats; it’s a cheat sheet for refining your entire content strategy.
Let's say you discover that 70% of your audience is made up of males aged 18-24 living in the United States. That's a huge clue! It helps you dial in your humor, the cultural references you make, and even the pacing of your edits. For context, you can compare this to YouTube's overall user base, where 54.4% are male and the largest age group is 25-34. Seeing how your channel differs from the platform average is incredibly revealing.
Finding the Perfect Upload Time
One of the most valuable reports—and one too many creators ignore—is "When your viewers are on YouTube." It's a simple-looking chart, but it's pure gold for scheduling your uploads. It shows you the exact days and hours when most of your audience is actively browsing the site.
Key Insight: Dropping your video right before these peak hours gives it a massive head start. That initial surge of views and watch time from your subscribers is a powerful signal to the algorithm that your video is a winner.
Instead of throwing your video up whenever it’s finished, you can now plan your uploads. Schedule your video to go live an hour or two before you see the darkest purple bars on that chart. This ensures it lands at the top of your subscribers' feeds right when they’re sitting down to watch.
Spying on Your Audience (The Right Way)
Ever wonder what other creators your viewers watch? YouTube hands you this information on a silver platter in the "Other channels your audience watches" report. This report is an absolute goldmine for finding new video ideas and potential collaborators.
By digging into these channels, you can:
- Spot Content Gaps: What topics are they hitting that you aren't? Maybe there's a fresh angle you can take that would perfectly serve your shared audience.
- Find Collaboration Partners: These channels are already popular with your viewers. A collaboration would be a natural fit and could introduce your content to a massive, relevant new audience.
- Benchmark Your Content: Pay attention to the style, length, and production quality of the videos your audience already loves. This gives you a clear idea of their expectations.
When you start blending all these insights, you're no longer just staring at numbers. You're building a real relationship with your community. This deep understanding is what helps you serve them better, and in turn, you'll naturally figure out how to increase your YouTube watch time in a way that feels authentic and sustainable.
Turning Your Analytics into Actionable Strategy
Knowing what your YouTube analytics mean is one thing. But using that data to make smarter decisions for your next video? That's where the real growth happens. It's the difference between being a reactive creator and a proactive strategist, building a feedback loop where every video you publish is an improvement on the last.
Think of your analytics dashboard as a health check-up for your channel. Every metric points to a strength or a weakness. Your job is to connect those signals to a concrete plan, moving from just seeing the numbers to actively improving them.
Diagnosing Common Content Problems
Let's walk through a couple of real-world scenarios that nearly every creator bumps into. When you start treating your analytics like a doctor reading a patient's chart, you can prescribe the right fix every time. This is how understanding your analytics becomes your secret weapon.
Here are a few common symptoms and their likely cures:
-
Problem: Your Click-Through Rate (CTR) is amazing, but your Audience Retention is in the gutter.
- Diagnosis: Your title and thumbnail are doing their job perfectly—they’re making a promise that gets people to click. The problem is, the video itself isn't delivering on that promise, so viewers are bailing almost immediately.
- Solution: Go back and watch the first 30 seconds of that video. Does it get straight to the point? Is the hook strong enough? You probably need to rework your intros to deliver on the title’s promise right away.
-
Problem: Your CTR is low, but the few people who click watch for a long time (high Audience Retention).
- Diagnosis: This is the flip side of the coin. Your content is gold—it’s engaging and holds viewer attention. But your "packaging" (the title and thumbnail) isn't compelling enough to get people in the door.
- Solution: It's time to test new thumbnails and titles. Brainstorm more intriguing ideas, make the benefit clearer, and create more visual pop. This is often a much easier fix than reshooting an entire video.
Having a mental map for these situations helps you react faster, especially when you're looking at real-time data from a brand-new video.
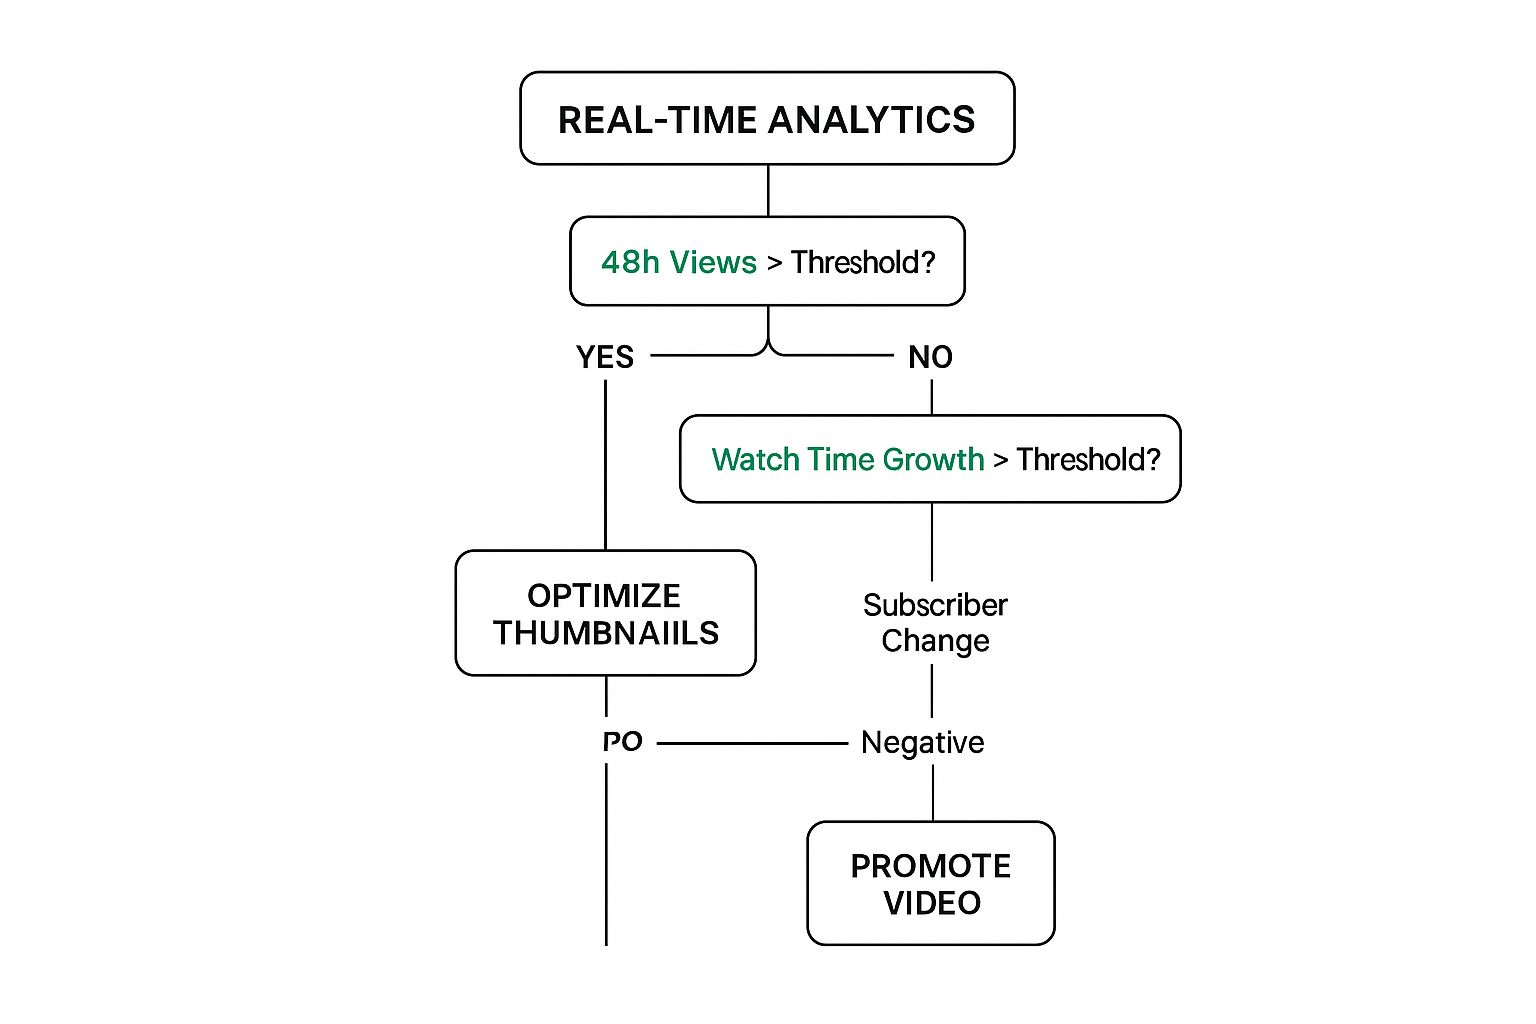
This kind of decision tree can help you quickly figure out what a video needs within its first 48 hours, telling you whether to double down on promotion or tweak its packaging.
To make this even more practical, here’s a quick-reference table that connects common issues you'll spot in your analytics to specific, actionable strategies.
| Common Problems and Actionable Solutions | | :--- | :--- | :--- | | Problem (Analytics Signal) | Potential Cause | Actionable Solution | | High CTR, Low Retention | Misleading title/thumbnail; weak video hook. | Rework the first 30 seconds to deliver on the thumbnail's promise faster. | | Low CTR, High Retention | Unappealing or unclear title/thumbnail. | A/B test new thumbnails and titles to better reflect the high-quality content. | | Sharp drop-off at a specific point | Boring segment, confusing explanation, or technical issue. | Review that exact timestamp. Can you edit it to be tighter? Add B-roll or graphics? | | Low overall Watch Time | Topic isn't engaging enough, or the video is too long for the subject. | Focus on topics with proven high watch time in your niche. Experiment with shorter video formats. | | Low Views from Browse/Suggested | Content isn't aligning with what the algorithm thinks your audience wants. | Analyze your top-performing videos and create more content around those successful themes and formats. |
Think of this table as your go-to diagnostic tool. When you see a red flag in your data, find the corresponding problem here and you’ll have a clear starting point for fixing it.
Conducting a Simple Channel Audit
To build a real, long-term strategy, you need to step back and conduct regular channel audits. Don't worry, it's not as scary as it sounds. It just means taking a systematic look at what's working—and what's not—across your entire channel.
Key Insight: Your best-performing videos are your blueprint for what to do next. Your worst-performing videos are your most valuable lessons on what to avoid. You can't afford to ignore either.
First, pull up your top 5-10 videos by watch time. What do they have in common? Are they all about one specific topic? Do they share a similar format, length, or editing style? Your audience is literally telling you what they love. Your only job is to listen and give them more of it.
Now, do the exact same thing for your worst-performing videos. Be brutally honest with yourself. Why did these videos flop? Was the topic too obscure? Was the audio quality bad? Was the pacing a snoozefest? Identifying these mistakes is the key to never making them again. This kind of deep dive is a huge part of our guide on YouTube SEO for beginners, because it directly shapes your future content strategy.
Ultimately, YouTube Analytics isn't just about charts and graphs. It’s about learning how to analyze marketing data for data-driven insights and turning your creative intuition into a repeatable formula for success.
Still Have Questions About YouTube Analytics?
Even after digging through all the tabs in your dashboard, you’ll probably still have some questions pop up. It happens to everyone. Think of this section as your quick-reference FAQ for some of the most common head-scratchers creators run into.
How Often Does YouTube Analytics Update, Really?
This is a big one, and the answer isn't as simple as you'd hope. It all depends on what data you're looking at.
Key stats like Views and Watch Time are practically live. You can see them updating within minutes in the "Realtime" report, which is great for getting a quick pulse on a new video. But for the deeper stuff—like revenue or specific audience demographics—YouTube needs more time to process everything. Expect to wait 48-72 hours for that data to be fully baked and accurate. My advice? Don't jump to any big conclusions about a video's performance until at least two days have passed.
So, What’s a “Good” Click-Through Rate on YouTube?
Ah, the million-dollar question. The honest answer is that there's no universal magic number for a good Impressions Click-Through Rate (CTR). It can swing wildly depending on your niche, the video topic, and where your views are coming from. A video discovered through "Browse Features" will have a very different CTR from one found in YouTube search.
Still, you need a benchmark to aim for. For most channels, anything between 4% and 5% is a solid starting point. If you're consistently hitting above 6%, your thumbnails and titles are really connecting with people. And if you see a CTR over 10%? That’s exceptional work.
Ultimately, the goal isn't to hit some arbitrary industry number. It's about beating your own average. Your real mission is to improve your channel's CTR with every single video.
Can I See Analytics for Just One Part of My Video?
You sure can, and this is where things get really interesting. Head over to the Audience Retention graph. This is your secret weapon for understanding exactly how your video lands with viewers, moment by moment.
It lets you zoom in on specific parts of your video to see:
- Re-watch spikes: See those little bumps in the graph? That’s where viewers hit the rewind button. It’s a goldmine showing you what they loved most.
- Viewer drop-offs: The sharp cliffs and steep slopes in the graph are just as important. They show you the exact moment you lost someone's attention, telling you what needs to be tighter or more engaging next time.
Learning to read this graph is how you go from knowing if people watched to understanding how they watched.
One of the best ways to improve retention is by adding chapters. They make your videos easy to navigate and help your viewer experience. TimeSkip can generate SEO-optimized chapters for you in seconds with just one click. You can install the Chrome extension and get two free videos by checking out the TimeSkip website.
