Forget just guessing what your audience wants to see next. The real story behind your channel's success isn't just about subscriber counts; it's tucked away inside your YouTube analytics.
A lot of creators get hung up on surface-level numbers, but that's like judging a book by its cover. The data is what separates channels that thrive from those that just tread water.
This is about seeing the bigger picture your viewers are painting with every click, watch, and share. Just like a business digs into its sales reports, you need to dig into your viewer data. If you're new to this, our complete guide on YouTube analytics explained is a great starting point for getting familiar with the core metrics.
Pinpoint Your Best Growth Opportunities
Think of your analytics dashboard as a treasure map pointing you straight to where the gold is buried. It shows you which topics genuinely grab your audience, uncovering opportunities you'd otherwise completely miss.
Here’s what you can discover:
- Content That Converts: Find out exactly which videos are turning casual viewers into loyal subscribers.
- Traffic Source Deep Dive: Are people finding you through YouTube search, suggested videos, or a link on another website? This tells you exactly where your promotional energy is paying off.
- Audience Demographics: Get to know who is actually watching. Knowing their age, location, and gender helps you create content that speaks directly to them.
The big takeaway here is simple: analytics gives you a direct line to what your viewers are thinking. Don't treat it like homework. See it as an ongoing conversation where your audience tells you exactly what they want you to make next.
This strategic mindset isn't just for YouTube, either. Understanding the fundamentals of how to measure social media success provides a solid framework for making sense of data on any platform you use.
Understand Your Massive Potential Audience
The sheer scale of YouTube is staggering, which makes using analytics even more essential if you want to get noticed.
By 2025, it's estimated that YouTube will have somewhere between 2.70 to 2.85 billion monthly active users. That’s a massive potential audience. Every single day, over 122 million people log on to YouTube and collectively watch more than a billion hours of video. By diving into your analytics, you can start carving out your own piece of that audience.
Exploring Your YouTube Analytics Dashboard
Welcome to your channel's command center. I know the YouTube Studio analytics dashboard can look a bit overwhelming when you first open it, but trust me, it’s not as scary as it seems. The best way to think about it is as a direct conversation with your audience—this is where you find the real story behind your numbers.
Instead of trying to absorb every single metric at once, let's zero in on the three tabs that matter most: Reach, Engagement, and Audience. Each one answers a fundamental question about your content's performance. Getting comfortable with these three is the key to building a content strategy that’s based on what actually works, not just what you think works.
Navigating the Core Analytics Tabs
Your journey into youtube video analytics really begins once you understand what each of these main sections is trying to tell you. Let's quickly break them down before we get into the nitty-gritty of the data.
-
Reach: This is your "How are people finding my videos?" tab. It’s all about your content's visibility on YouTube, tracking things like impressions and, crucially, how many of those impressions turn into clicks.
-
Engagement: Once someone clicks, this tab answers, "Are they sticking around?" It measures how long viewers actually watch, giving you raw, honest feedback on whether your video delivered on its promise.
-
Audience: This is the "Who is watching?" tab. It’s a goldmine of demographic data and viewing habits, helping you paint a clear picture of the community you're building.
The real magic happens when you connect the dots between these tabs. For instance, high reach but low engagement is a classic sign of a great thumbnail and title that leads to a disappointing video. That's a powerful insight.
Here’s a look at the main overview page, which pulls the most important data from these areas into one place.

This snapshot gives you a quick health check of your channel, highlighting your top videos, real-time activity, and other key metrics without making you dig for them.
From Data Points to Real-World Insights
Okay, let's move past the definitions and get practical. How do you turn these numbers into decisions that make your next video better?
Let's say you check the Reach tab and see that your latest video has a really low click-through rate (CTR). That's not just a bad number; it's a clear signal that your thumbnail and title aren't cutting through the noise. Your immediate takeaway? It's time to experiment with a bolder thumbnail or a more intriguing title for your next upload.
Now, pop over to the Audience tab. You might find that a huge chunk of your viewers also binge-watch channels that use a specific fast-paced editing style. This isn’t a suggestion to copy them. Instead, it’s an insight telling you that your audience enjoys that kind of energy. You can then think about how to bring a similar feel to your content while keeping it authentic to your own style. This is exactly how you use youtube video analytics to sharpen your creative instincts.
The Metrics That Truly Drive Growth
When you first dive into your YouTube video analytics, it's easy to get fixated on the big, flashy numbers like total views or subscriber count. But if you want to understand what really makes the YouTube algorithm sit up and take notice, you need to look a little deeper. From my experience, real, sustainable channel growth boils down to two core metrics: Click-Through Rate (CTR) and Average View Duration (AVD).
Think of it this way: CTR and AVD work together to tell a story. A high CTR is your first win—it means your thumbnail and title were compelling enough to make someone stop scrolling and click. A strong AVD is the crucial second act, proving that your content delivered on that initial promise. When you nail both, YouTube sees a video that not only attracts viewers but genuinely satisfies them.

This powerful combination is a direct signal to the algorithm that your video is high-quality. As a result, YouTube becomes much more likely to push your content out to a wider audience on the home page and in suggested video feeds. That’s how you grow.
Decoding Your Audience Retention Graph
The Average View Duration metric is best understood through the audience retention graph. Honestly, this chart is one of the most powerful yet underutilized tools in all of YouTube Studio. It gives you a second-by-second playback of your audience's attention, showing you exactly where they were hooked and, more importantly, where they clicked away.
Don't just look at the final percentage. The real insights are in the shape of the graph itself. Here’s what to watch for:
- A steep drop in the first 15-30 seconds: This is a classic sign of a weak hook. Your intro might be too slow, or it doesn't align with what your title and thumbnail promised.
- Sudden dips later on: These are your content's weak spots. Go back and watch these exact moments. Did you ramble? Was there a jarring edit, a sudden drop in audio quality, or a boring segment?
- A slow, gradual decline: This is perfectly normal. No one has 100% retention. The goal is simply to make this downward slope as gentle as possible for as long as possible.
- Bumps or spikes: These are gold! A bump means people are re-watching that specific part. Analyze these sections—what did you do right? Replicate that magic in future videos.
By studying these patterns, you can diagnose your content's weaknesses with surgical precision. For instance, if you notice a dip every time you switch topics, maybe you need to add a quick graphic or a stronger verbal transition to guide viewers. To see how AVD fits in with other key numbers, you can explore this detailed breakdown of YouTube channel metrics.
The Power of a Strong First Impression
Your Click-Through Rate (CTR) is the first gate you have to get through. You could create the most incredible video in the world, but if the packaging—the thumbnail and title—is weak, no one will ever see it. A low CTR is a direct message from the audience to YouTube that your video simply isn't grabbing their attention.
A "good" CTR is relative and changes from niche to niche. The best approach is to benchmark against your own channel. If a new video's CTR is way below your average, that's your cue to rethink your thumbnail or title strategy for the next one.
Getting this right is more important than ever. In 2024, YouTube's ad revenue soared to $36.1 billion, a 14.6% jump in just one year. With over 113.9 million channels on the platform, making a strong first impression is non-negotiable. To understand how these YouTube metrics fit into a broader content strategy, it's worth learning about other essential content performance metrics as well.
Turning Analytics Data Into Action
Looking at your YouTube video analytics is one thing, but real growth kicks in when you use that data to build a solid plan for your next video. Raw numbers are just trivia until you use them to form a hypothesis, test it, and see what happens. This is how you go from just watching your stats to actually being a channel strategist.
Let's walk through a common scenario. You post a video and, boom, it gets a ton of impressions. Feels great, right? But then you dig into the click-through rate (CTR), and it's painfully low. This isn't a failure; it's specific, actionable feedback from your potential audience.
What the data is screaming at you is that your topic has promise—YouTube is showing it to people—but the packaging isn't sealing the deal. Your thumbnail and title just aren't compelling enough to earn that click. The answer isn't to ditch the topic. Instead, you've just found your next mission: A/B test a new thumbnail or write a more magnetic title for a similar video.
From Diagnosis to Strategy
Here’s another challenge I see all the time: traffic sources. What if you look at your analytics and see that nearly all your views are from YouTube search, with almost none coming from "Suggested Videos"? This is a huge, flashing sign pointing to a missed growth opportunity.
Search traffic is great, don't get me wrong. But suggested videos are how channels truly blow up. This insight tells you that while your SEO game is strong, your content might not be doing its part to keep viewers hooked on the platform—which is exactly what YouTube's algorithm is designed to reward.
So, how do you fix it? You could:
- Dive into your retention graphs. Pinpoint where viewers are dropping off. At those exact moments, try adding pattern interrupts like on-screen text, a quick B-roll cut, or a change in your tone to recapture their attention.
- Create a direct follow-up video. End your current video with a powerful call-to-action that teases the very next video in a series. This actively encourages a binge-watch session.
- Spy on the "up next" videos. After one of your videos ends, what does YouTube suggest people watch next? This gives you incredible clues about what the algorithm thinks is a logical next step for your viewer.
This simple flow chart really breaks down how to identify and act on what your traffic sources are telling you.
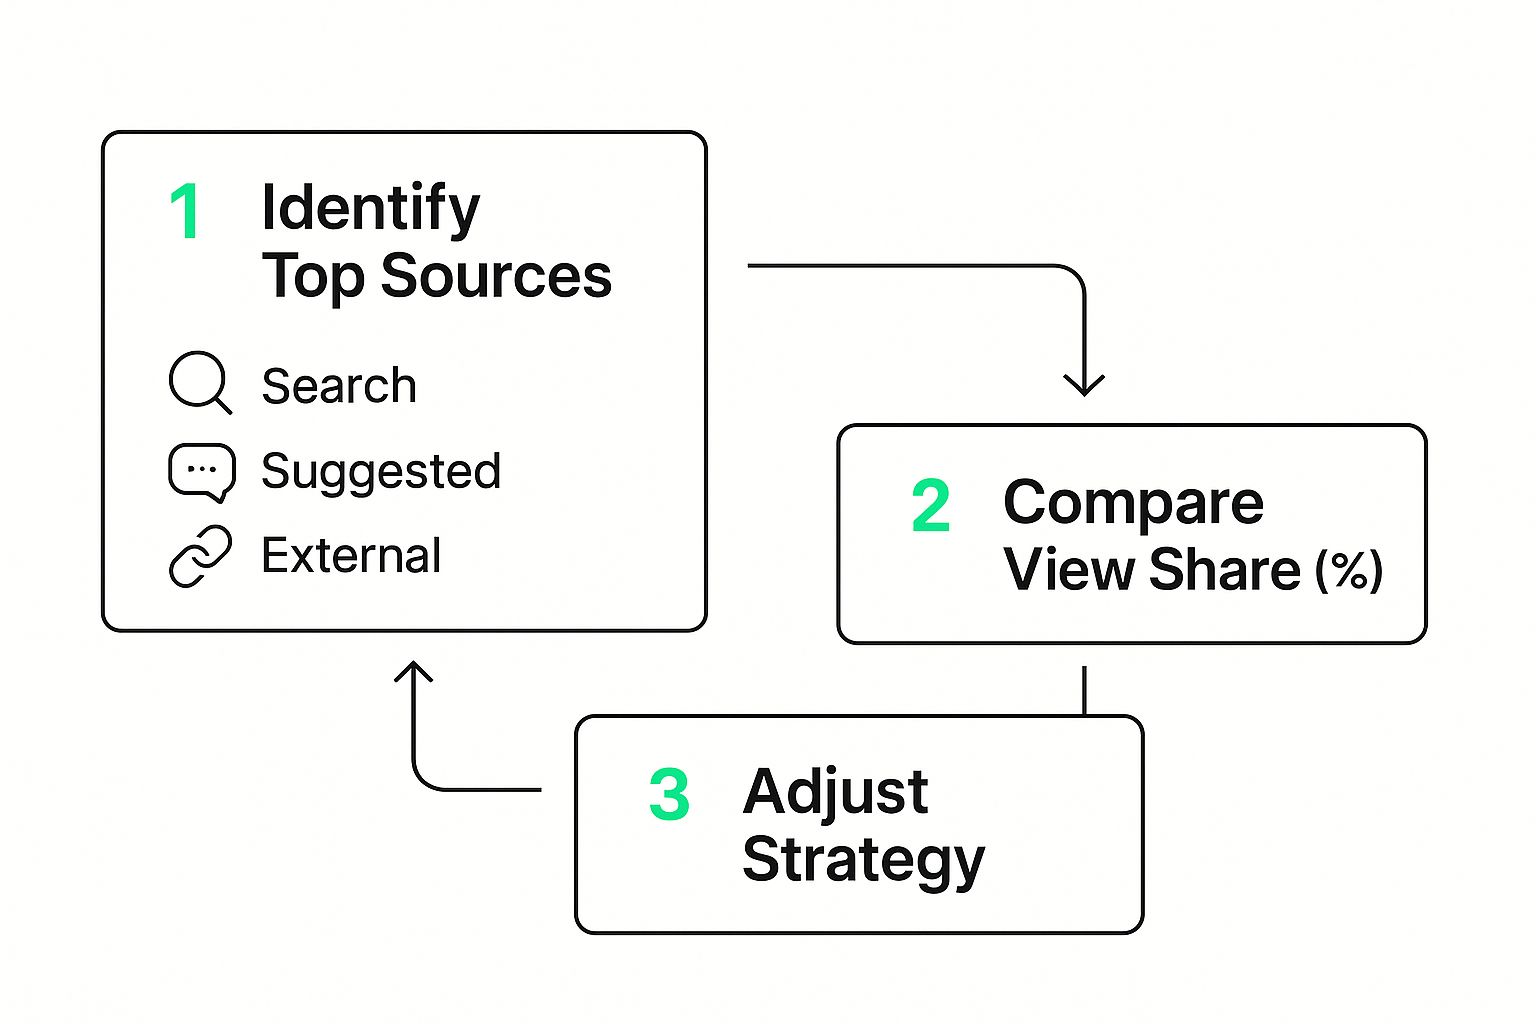
As you can see, it's a powerful loop: figure out where your views are coming from, see how those sources perform against each other, and then tweak your content strategy based on what you find.
Building Your Content Hypothesis
Think of every new video as an experiment. It should be designed to answer a specific question that came directly from your analytics. This methodical approach is so much more effective than just throwing content at the wall and hoping something sticks.
Your content hypothesis is your strategic best guess. It’s a clear statement, like: "I believe that including a human face in my thumbnails will increase my CTR by 2% because my audience retention data shows viewers respond positively to a more personal connection."
This process transforms your content creation from a guessing game into a strategic feedback loop. You spot a problem (low CTR), form a hypothesis (faces in thumbnails will help), run an experiment (make new thumbnails), and measure the results.
It’s about more than just watching metrics; it's about knowing how to apply these insights to make your videos better. This really gets into the core of measuring advertising effectiveness and proving your work is paying off. By constantly testing, learning, and refining, you build an unstoppable engine for channel growth that’s fueled by what your audience actually wants to see.
Taking Your Analytics Game to the Next Level
Once you've got the basics down, it’s time to dig into the analytics features that give you a real competitive edge. Honestly, this is where you separate the good channels from the truly great ones. A lot of creators get stuck on the surface-level numbers, but the hidden stories in your advanced data are where you'll find the keys to accelerated growth.
One of the most powerful things you can do is stop looking at a video's performance in a vacuum. Instead, benchmark it against your own channel's history. This instantly tells you if your latest upload is a smash hit, just average, or a dud that needs a closer look.
How New Videos Stack Up: Using the Comparison Tool
Think of the 'Comparison' feature in YouTube Studio as your secret weapon for gauging a new video’s traction. It lets you put a new video's performance head-to-head with your channel's "typical" performance over the same period—like those critical first 24 hours.
Let's say you just dropped a video trying out a new editing style. After a day, you can pop into the comparison tool and see how its views, click-through rate (CTR), and average view duration compare to your channel's usual first-day numbers. If the new video is crushing your typical metrics, you've got solid proof that the new style is a winner with your audience.
This isn't just for patting yourself on the back. If a video is tanking compared to your average, that's immediate, actionable feedback. Maybe the topic wasn't as hot as you thought, or the thumbnail just didn't connect with your viewers like your others do.
Pinpointing Your True Growth Engines
Do you know which of your videos are actually convincing people to subscribe? It’s a crucial question, and the 'Subscribers by video' report, tucked away in 'Advanced Mode', gives you the straight answer.
This report cuts through the noise. It shows you a simple, powerful list of which videos brought in the most subscribers over a specific time. You might be surprised. I’ve often found that my most-viewed video isn't the one that's building my community. It’s usually a deeper, high-value tutorial or a more personal story that finally gets a viewer to click "subscribe."

Here's how to use that intel:
- Analyze your top subscriber-earning videos: What's the common thread? Is it the topic? The format? A specific call-to-action you used at the end?
- Make more of what works: Use these findings to blueprint future content that’s deliberately designed to convert new subscribers, not just chase views.
This kind of detailed analysis is a cornerstone of smart channel management. To dive even deeper into refining your strategy with these insights, our complete guide on YouTube video optimization will show you exactly how to apply what you've learned for maximum impact. When you know precisely what content grows your audience, you can put your creative energy where it will pay off the most.
Diagnosing Common Analytics Problems
When you see a metric trending down, it's easy to panic. But every dip tells a story. This table breaks down some common problems, what they usually mean, and what you can do about them.
| The Problem You See | What It Likely Means | How You Can Fix It |
|---|---|---|
| Low Click-Through Rate (CTR) | Your thumbnail and title aren't compelling enough to make people click. The impression is there, but the interest isn't. | Test new thumbnail styles (brighter colors, expressive faces). Write more intriguing or benefit-driven titles. |
| High CTR but Low Audience Retention | You made a great promise with your title/thumbnail, but the video content didn't deliver, causing viewers to leave early. | Make sure your first 15-30 seconds hooks the viewer and confirms what the title promised. Get to the point faster. |
| A Sharp Drop-Off at a Specific Point | Something at that exact moment in the video is turning viewers off. It could be a boring segment, a jarring ad, or a confusing point. | Review that specific timestamp in your video. Could you have edited it tighter? Was your call-to-action too early? |
| Low Views but High Retention & CTR | Your video is great, but YouTube isn't showing it to enough of the right people. This often points to a topic with low search demand or poor keyword targeting. | Research keywords with higher search volume. Focus on topics your target audience is actively looking for. |
Think of your analytics as a conversation with your audience. By learning to interpret these signals correctly, you can stop guessing and start making informed decisions that consistently improve your channel's performance.
Common Questions About YouTube Analytics
As you spend more time in your YouTube analytics, you're going to start asking the same questions every creator does. Getting comfortable with your data isn't just about knowing what the numbers mean; it's about building a healthy mindset around them. Let's dig into a few of the big ones I see all the time.
How Often Should I Check My Stats?
This is probably the most common question I get. Honestly, it’s not about how often you look, but why you’re looking.
If you find yourself glued to the real-time view, hitting refresh every five minutes, you’re just setting yourself up for anxiety and burnout. Trust me, it doesn't help the video perform any better.
A much healthier rhythm is to check with a specific goal in mind. For instance, popping in during the first 24-48 hours is a great idea to see if a new thumbnail is hitting the mark or if you need to swap it out. Beyond that initial window, a deeper look once a week or every two weeks is plenty to spot real, meaningful trends without drowning in the daily fluctuations.
Can Analytics Predict if My Video Will Go Viral?
Ah, the million-dollar question. Can analytics tell you if you've got a viral hit on your hands? The short answer is no, not really. But they can give you some powerful clues. Think of early data as hints, not guarantees.
For a video to even have a shot at blowing up, you need a killer combination of a high Click-Through Rate (CTR) and a high Average View Duration (AVD) right from the start.
If you publish a video and see an unusually high CTR—way above your channel's normal performance—and viewers are sticking around longer than usual within the first few hours, that’s a massive signal to the YouTube algorithm. It’s telling YouTube, "Hey, people are really clicking on and enjoying this!"
The key isn't just the numbers themselves, but the velocity behind them. A video that rockets past your channel’s typical benchmarks in its first day is signaling that it has broad appeal. This is the closest you'll get to a "prediction."
This kind of strong, early feedback is what convinces YouTube to start pushing your content to a wider audience through suggested videos, which is exactly how viral growth happens.
What Is a Good Click-Through Rate?
Everyone wants to know the magic number for a "good" CTR. The truth? There isn't one. It's completely relative to your channel, your niche, and even the specific video topic.
It’s a classic case of comparing apples to oranges. A gaming channel might be thrilled with a 4% CTR, while a highly specialized channel on tax law could regularly pull in an 8% CTR.
So, stop comparing your channel to others. The only benchmark that truly matters is your own.
Your goal should be simple: beat your channel's average. If your videos typically land a 5% CTR, and your new one hits 7%, that's a fantastic win. It’s a clear sign that your thumbnail and title resonated strongly, and you should figure out why so you can do it again.
Ready to stop guessing and start growing? TimeSkip automatically creates SEO-optimized chapters for your videos in seconds, boosting visibility and viewer retention. Get your two free video generations and see the difference.
