If you're serious about growing a YouTube channel, your analytics dashboard is the single most important tool you have. It's your direct line to understanding what actually resonates with viewers, turning the "upload and pray" method into a predictable growth strategy.
Think of your analytics not as a report card, but as a roadmap. This data shows you who is watching, how they're finding your videos, and what keeps them hooked.
Why YouTube Analytics Are Your Creative Compass

The most successful creators I know live in their analytics. They treat this data not as a chore, but as their most valuable creative partner. It’s the difference between fumbling around in the dark and having a compass that guides every single content decision.
Your analytics tell a story. They reveal which thumbnails are grabbing attention, the exact moments viewers are clicking away, and where your most loyal audience is coming from. Ignoring these insights is like getting thousands of pieces of direct feedback and throwing them in the trash.
Moving Beyond Surface-Level Numbers
True channel growth isn't just about chasing views or subs; it's about building a real, sustainable connection with an audience. To do that, you have to look past the vanity metrics you see on your public video page. The real magic happens when you understand the behaviors behind those numbers.
Your analytics dashboard can answer some critical questions:
- Audience Demographics: Are you actually reaching the people you think you're reaching? Or is there a completely unexpected group of viewers you could be catering to?
- Traffic Sources: How are people finding you? Is it through YouTube search, the suggested videos sidebar, or an external site? Knowing this tells you where to focus your efforts.
- Viewer Retention: Where are the drop-off points in your videos? Pinpointing these moments helps you tighten up your editing, improve your pacing, and fix your intros.
When you focus on these deeper insights, you start to understand the why behind your channel's performance. You can see a full breakdown of the most essential video performance metrics to really dial in on what matters.
The Growing Importance of Data
The value of analytics has exploded right alongside the platform itself. YouTube's user base has grown from around 0.8 billion users back in 2012 to a projected 2.7 billion by 2025.
That incredible growth means there’s a massive, diverse audience out there. But it also means way more competition, making data-driven decisions more critical than ever to stand out.
Your analytics dashboard is the most honest focus group you'll ever have. It provides unfiltered feedback on what's working, what's failing, and where your biggest opportunities for growth are hiding.
Ultimately, getting comfortable with your analytics empowers you to create content that doesn't just get seen, but gets watched, shared, and remembered.
Your Guided Tour of the Analytics Dashboard
Jumping into your YouTube Studio analytics for the first time can feel like you’ve just been handed the keys to a spaceship. There are buttons, graphs, and flashing lights everywhere. But don't worry—once you know what each dial does, you'll be navigating your channel's data like a seasoned pro.
Let's walk through the core tabs that tell the story of your channel's performance. I like to think of them—Overview, Reach, Engagement, and Audience—as different chapters in a book. Each one reveals a piece of the puzzle, and together, they give you the full picture.
The Reach Tab: How People Discover Your Videos
The Reach tab is all about how viewers are finding you out in the wild world of YouTube. The two numbers you absolutely need to watch here are Impressions and Click-Through Rate (CTR).
Impressions tell you how many times your video's thumbnail was shown to a potential viewer. Your CTR, on the other hand, is the percentage of those people who actually clicked to watch. Simple enough, right?
But this is where the detective work begins. If you see a ton of impressions but your CTR is hovering below 3%, that's a classic sign of a disconnect. The algorithm is doing its job and showing your video to people, but your thumbnail or title just isn't grabbing their attention. That's your cue to start experimenting with your "packaging."
On the flip side, a really high CTR with low impressions might mean your video is a massive hit with a small, niche audience, but YouTube hasn't figured out who else to show it to yet.
This is the fundamental flow: you need clicks to get views, and views lead to watch time.
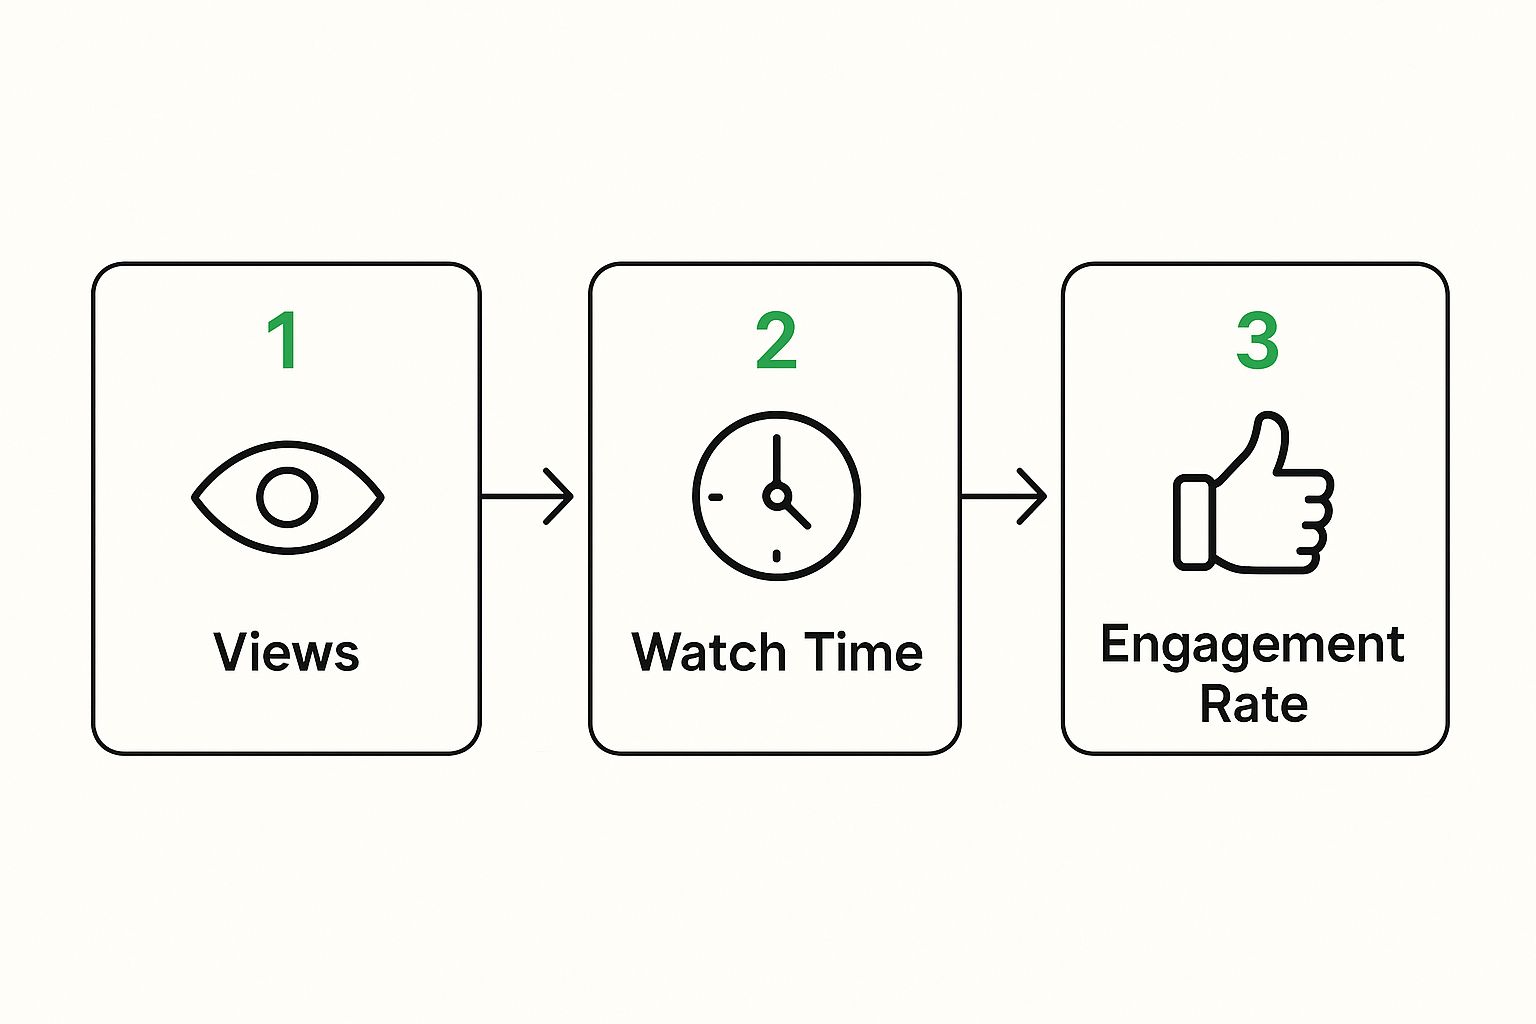
As you can see, getting that initial click is just step one. The real magic happens when you can keep them watching.
The Engagement Tab: Are They Sticking Around?
Once a viewer clicks, the Engagement tab picks up the story. The two heavy hitters here are Watch Time and Audience Retention. Watch time is the grand total of all the minutes people have spent watching your stuff, but the audience retention graph is where you'll find the gold.
This graph is your second-by-second playbook, showing you exactly where people are hooked and where they're bailing.
- Sudden Dips: A sharp drop is a red flag. It often points to a boring segment, a confusing explanation, or maybe a jarring cut or audio change.
- Gradual Declines: A slow, steady downward slope is totally normal. But if it's a steep cliff, it suggests your video isn't delivering on the promise you made in the title and thumbnail.
- Spikes or Bumps: See those little bumps in the graph? Those are your best friends. They show you where viewers are re-watching a specific part. Go figure out what you did right in those moments and do more of it!
Your audience retention chart is the most honest feedback you'll ever get. It's not criticism; it's a precise, data-driven road map for improving your editing, pacing, and storytelling in the very next video you make.
Finally, the Audience tab helps you understand who these viewers are—their age, gender, location, and even what other channels they watch. When you combine those insights with your engagement data, you start to build a crystal-clear picture of your ideal viewer.
For a deeper look into all the numbers that can define your channel's success, it’s worth taking the time to understand all the core YouTube channel metrics at your disposal.
Turning Viewer Data Into Smarter Content
That screenshot is a familiar sight, but the real magic happens when you start turning those numbers into your next great video. Let’s be honest: analytics without action are just numbers on a screen. The goal is to build a feedback loop where the data from your last video directly informs the strategy for your next one.
This is where you bridge the gap between abstract data and real creative decisions. Think of your analytics as a conversation with your audience—their clicks and watch time are their side of the dialogue. Your job is to listen and respond.
Decoding Your Traffic Sources
One of the most powerful reports for shaping your content calendar is Traffic Sources. This report doesn't just tell you how people found your video; it’s a goldmine of clues for what to make next.
-
Dominated by "YouTube Search"? This is a huge green light. It means your videos are successfully answering questions people are actively typing into the search bar. Your immediate next step is to double down on keyword research. Find related long-tail keywords and create a series of videos to own that entire topic cluster.
-
"Browse Features" on Top? Nice work! This tells you that your thumbnails and titles are crushing it on the YouTube homepage and catching the eye of a cold audience. For your next video, lean into broad-appeal topics in your niche and write compelling, curiosity-driven titles that make people want to click.
-
"Suggested Videos" Driving Views? This one is my favorite. Go check which specific videos are suggesting yours. If your content is consistently popping up after a certain creator's videos, you know for a fact that your audiences overlap. Consider making content on similar topics to what those creators are covering to capture even more of that highly relevant traffic.
Pivoting your content strategy based on where your viewers are coming from is a cornerstone of smart channel growth.
Turning Retention Dips into Wins
Your Audience Retention graph is a secret weapon for perfecting your video structure. Don't just glance at the average percentage; zoom in on the exact moments where viewers are dropping off.
See a sharp dip in the first 30 seconds? That usually means your intro failed to deliver on the promise of your thumbnail and title. A sudden drop in the middle could signal a segment that dragged on too long or a point that was confusing.
Use these dips not as failures, but as specific, actionable editing notes. The data is literally telling you, "Right here, at 4 minutes and 12 seconds, you lost my attention." Fix that pattern in your next video, and you'll see your watch time climb.
By the way, systematically improving these metrics is a core part of learning how to measure content performance across your entire channel. In recent years, YouTube's video analytics have become indispensable for creators looking to optimize performance. Instead of just chasing views, top channels use a detailed array of metrics—like watch time, audience retention, and thumbnail click-through rates—to really understand viewer engagement. To learn more about how creators are adapting to these tools, you can explore additional insights on YouTube analytics from Outfy.com.
This whole process creates a repeatable system for making videos you know your audience actually wants to watch from start to finish.
Finding Hidden Growth Opportunities in Your Data
The main analytics tabs give you a great bird's-eye view, but the real magic happens when you dig a little deeper. Once you're ready to go beyond the basic reports, you’ll want to head straight for Advanced Mode in your YouTube analytics dashboard. This is where you uncover the kind of data that can actually shape your content strategy.
This isn’t about drowning in spreadsheets. It’s about asking smarter questions to get precise answers. Instead of just knowing a video did well, you can finally understand why it crushed it. This is how you stop guessing and start building a repeatable formula for videos your audience genuinely loves.
Comparing Videos Side-by-Side
One of the most powerful things you can do in Advanced Mode is compare two videos directly. Let's say you have two videos on a similar topic. One took off like a rocket, and the other… well, it didn’t. Comparing them lets you pinpoint exactly what made the difference.
For example, you might find that:
- Video A had a way higher click-through rate (CTR) in its first 24 hours. That’s a huge clue that its title and thumbnail were way more effective at grabbing that initial attention.
- Video B had a lower CTR but a much better average view duration. That means the people who did click were way more hooked by the actual content.
This kind of side-by-side comparison turns vague hunches into hard data. You might realize Video A’s thumbnail was cleaner and bolder, while Video B’s intro got straight to the point. Boom. Now you have a clear hypothesis for your next upload: combine the bold thumbnail from A with the punchy intro from B.
Uncovering Collaboration Goldmines
The standard Audience tab is useful, but Advanced Mode has some hidden gems. My absolute favorite is the report called "Other channels your audience watches." This isn't just a list of names; it's a strategic blueprint for finding your place in the YouTube ecosystem.
This report is your direct line to understanding your audience's other interests and finding your true peers. It's the single best tool for identifying potential collaborators whose viewers are already primed to enjoy what you do.
When you see a channel pop up here again and again, that's a massive signal that your audiences overlap. This opens up some incredible doors:
- Collaboration: Reaching out for a collab is no longer a cold pitch. You can confidently say, "Hey, it looks like our audiences really overlap. I think a video together would be a huge win for both our communities."
- Content Inspiration: Take a look at what topics are hitting big on those channels. This isn't about copying them. It’s about understanding the themes and formats that resonate with the people you’re both trying to reach.
By getting comfortable with these more sophisticated tools in your video analytics youtube dashboard, you shift from just reacting to data to actively hunting for it. You can spot trends before they blow up, diagnose what went wrong with surgical precision, and build a content strategy that gives you a serious edge.
Common Analytics Traps and How to Avoid Them

Diving into your YouTube data is a skill. And like any skill, it's riddled with common pitfalls that can send you chasing the wrong goals. Learning to spot these traps is your first step toward making smarter, more sustainable decisions for your channel.
The numbers don't lie, but they can definitely be misinterpreted.
One of the biggest mistakes I see creators make is chasing vanity metrics. Sure, a rising subscriber count looks amazing on your channel page, but it means absolutely nothing if those subscribers aren't actually watching your videos. True channel health lives in engagement, not just accumulation.
Think about it: a channel with 10,000 subscribers who show up for every video is far more valuable than one with 100,000 who subscribed years ago and never came back. Always, always prioritize metrics like Average View Duration and Audience Retention over raw subscriber numbers.
Resisting the Viral Video Overreaction
So, a video unexpectedly blows up. The temptation to immediately pivot your entire content strategy to chase that high again is massive. This is a classic trap. A single viral hit is often just an outlier—a fluke driven by a momentary trend or an external share, not a reliable sign of what your core audience wants long-term.
Instead of flipping your strategy on its head, treat that viral video as a valuable experiment. Dig into why it succeeded. Was it the topic? The format? A particularly punchy title? Pull out the elements you can sprinkle into your existing strategy, but don't abandon the consistent content that got you here in the first place.
Sustainable growth is built on repeatable success, not on chasing lightning in a bottle.
A viral video gives you a massive opportunity to attract new eyeballs. Your real goal should be converting that temporary attention into a loyal, long-term audience—not by changing everything overnight, but by integrating the successful elements into your consistent content.
The Nuance of Click-Through Rate
A low Click-Through Rate (CTR) can feel like a punch to the gut, but it's not always a bad sign. In fact, it can be a great one.
When YouTube sees potential in your video, it starts testing it with a broader, less familiar audience. Naturally, your CTR will drop. A 2% CTR with 500,000 impressions is often way better for channel growth than a 10% CTR with only 10,000 impressions from your die-hard fans.
Here’s a simple way to look at it:
- High CTR, Low Impressions: Your video is hitting the mark with your core audience, but it hasn't broken out to a wider viewership yet.
- Low CTR, High Impressions: YouTube is pushing your content to new people. This is a massive growth opportunity, even if the initial conversion rate is lower.
The key is to look at your video analytics youtube data with context. Avoid knee-jerk reactions to any single number. Instead, piece together the story all the metrics are telling you together. Every decision should be based on a holistic view of your channel's performance, not just one scary-looking stat.
Your YouTube Analytics Questions Answered
Jumping into your analytics dashboard for the first time (or the hundredth) can feel like opening a Pandora's box of numbers. Let's tackle some of the most common questions creators have and turn that data into something you can actually use.
How Often Should I Check My Analytics?
It's tempting to refresh the page every five minutes, but that's a fast track to burnout. Obsessing over the daily ebb and flow won't help you see the bigger picture.
I've found the sweet spot is a weekly deep-dive. This gives you enough data to spot real trends without getting stressed by normal, everyday fluctuations. Think of it as your Sunday strategy session.
Then, once a month, zoom out and look at your channel's overall health. Are you growing? Is your strategy working?
The only exception? A new video. It's smart to check in after the first 24-48 hours. That initial window is your best look at how the algorithm is testing your content and who it's showing it to.
What Is a Good Click-Through Rate on YouTube?
This is the million-dollar question, and the honest answer is: there's no magic number. A "good" Click-Through Rate (CTR) is a moving target that depends entirely on your niche, the video topic, and where people are discovering your content.
YouTube has said that for about half of all videos, the CTR falls somewhere between 2% and 10%. But that range is massive for a reason. Here's a real-world example:
- A new video pushed to your subscribers via notifications might easily get a 15% CTR. They already know and trust you.
- But when YouTube tests that same video on a brand new, colder audience through "Browse features," it might only pull a 3% CTR.
Don't compare your channel to someone else's. The only benchmark that matters is your own. Your goal should be to improve your channel's average CTR over time, video by video.
Why Do My Video Views Suddenly Drop Off?
We've all been there. Your video has a great first few days, the view count is climbing, and then... it hits a wall. It can be super discouraging, but it's a completely normal part of almost every video's life.
Most videos get an initial view spike from two places: your subscribers and the algorithm's first big push. After a few days or a week, that initial promotion naturally winds down.
Your views then settle into a more stable, long-term pace driven by sources like YouTube search and ongoing recommendations. Before you panic, pop over to your traffic sources. If you see the drop is mostly from "Browse features" or "Suggested videos," it just means the algorithm has moved on to promoting newer content. It's not a bad sign!
Can I Trust the Realtime Analytics Data?
The realtime tab is addicting, right? It's great for getting a quick feel for a new video's momentum in the first 48 hours. Think of it as a pulse check.
However, treat those numbers as an estimate. They're provisional and can fluctuate. The official, finalized data that shows up in your main dashboard a day or two later is what really counts.
Use the realtime view for a quick hit of dopamine, but base your big strategic decisions on the solid, finalized metrics.
Ready to boost your video's SEO and retention without the manual work? TimeSkip uses AI to generate optimized YouTube chapters in seconds. Try it for free and see how a 30-second setup can dramatically improve your channel's organic reach. Discover the power of automated chapters at TimeSkip.
