When we talk about measuring content performance, it's easy to get bogged down in vanity metrics. Sure, a spike in page views feels good, but it doesn't tell the whole story. The real goal is to understand how your content actually impacts the business—think audience engagement, lead generation, and ultimately, revenue.
This means shifting your focus from "How many people saw this?" to "What did they do next?" It's about connecting the dots between a piece of content and its contribution to your bottom line.
Ditching Vanity Metrics for What Really Matters
I've seen it countless times: a team celebrates a blog post that went viral, pulling in thousands of views. But a closer look reveals it generated zero leads and had a sky-high bounce rate. Meanwhile, another, less-viewed article quietly brought in a handful of high-quality demo requests. Which one is truly more valuable?
This is where a smarter approach comes in. You have to track the metrics that are directly tied to business growth. Forget the empty numbers and start measuring what genuinely moves the needle.
The Three Pillars of Content Performance
To get a clear picture of your content's real-world impact, it helps to organize your metrics around three core pillars.
-
Audience Resonance: Is your content actually hitting the mark with your target audience? Look at metrics like time on page, scroll depth, and social shares. These tell you if you're capturing attention and, more importantly, holding it.
-
Lead Generation: Is your content turning casual visitors into potential customers? This is where you track concrete actions like newsletter sign-ups, gated content downloads (like ebooks or whitepapers), and contact form submissions. This is how you build your pipeline.
-
Revenue Impact: Can you connect your content directly to a sale? This is the holy grail. It involves tracking how content consumption influences customer acquisition and calculating the true return on your content investment (ROI).
Before we dive deeper, let's summarize these crucial metrics in one place.
Key Content Performance Metrics at a Glance
This table breaks down the essential metrics, what they actually measure, and the business questions they help you answer. Think of it as your cheat sheet for proving content value.
| Metric | What It Measures | Business Question Answered |
|---|---|---|
| Time on Page | How long visitors stay on a specific page. | Is my content engaging enough to hold attention? |
| Scroll Depth | How far down a page visitors scroll. | Are people reading the entire article or just the headline? |
| Click-Through Rate (CTR) | The percentage of people who click a link or CTA. | Is my call-to-action compelling and relevant? |
| Conversion Rate | The percentage of visitors who complete a desired action. | Is my content effective at generating leads or sales? |
| Return on Investment (ROI) | The revenue generated from content vs. the cost to create it. | Is our content marketing a profitable investment? |
Having these numbers at your fingertips allows you to have much more strategic conversations about what's working and what isn't.
The most effective content strategies move beyond surface-level data to focus on meaningful engagement and conversion metrics. Key indicators like Time on Page, Click-Through Rate (CTR), and Conversion Rate paint a much richer picture of performance. You can explore a full breakdown of eight essential content performance metrics on project-aeon.com.
Ultimately, measuring content performance is about telling a complete story. It's about seeing how every blog post, video, and social media update contributes to the bigger picture—from a person's first click all the way to their final purchase. This data-backed perspective is what allows you to refine your strategy, prove your team's value, and create content that consistently delivers real results.
Building Your Measurement Toolkit
You can't fly blind and expect your content to perform well. To get real results, you need the right tools in your workshop. The whole point isn't just to hoard data, but to pull out actionable insights that actually shape your content strategy. Let's walk through the three essential tools that should form the core of any serious measurement plan.
First up, the non-negotiable: Google Analytics (GA4). This is your ground zero for understanding what people do once they land on your site. Don't just set it and forget it. The real magic happens when you configure custom goals. For example, you can set up a goal that tracks every single time a reader signs up for your newsletter from a specific blog post. Suddenly, you've connected a piece of content directly to a lead.

A quick look at a GA4 dashboard like the one above can give you a snapshot of user engagement, showing you which traffic sources are bringing in your most valuable readers. By spotting these trends, you learn which articles truly resonate and which ones fall flat.
Looking Beyond Your Website
While GA4 gives you the on-site story, it doesn't tell you the whole story. To see the bigger picture, you need to layer in data from SEO platforms and the social media sites themselves.
-
SEO Platforms: Tools like Ahrefs or Semrush are vital for tracking your content's health in the wild world of search engines. They're how you keep an eye on keyword rankings, find new backlink opportunities, and—critically—diagnose 'content decay' when an old post starts to lose traffic and needs a refresh.
-
Native Social Media Analytics: The data you get directly from YouTube, LinkedIn, or Instagram is pure gold. These built-in analytics provide platform-specific metrics, like video watch time or share rates, that GA4 simply can't see.
Here's a reality check from the field: 86% of marketers rely on website traffic metrics and 83% monitor engagement to measure success. And what are they using? The most common tools are Google Analytics (64%) and native social media analytics (44%), confirming just how essential they are.
By combining the insights from these three sources, you get a much richer, 360-degree view of what's working. This integrated approach ensures you're not just throwing content at the wall but are following 9 content creation best practices for massive growth in 2025.
Gauging Audience Resonance and Content Quality
So, your content is getting clicks. That's a great start, but is it actually connecting with anyone? This is where we move beyond vanity metrics and start looking at the real story behind the numbers. Likes and shares are nice, but they don't tell you if your content truly resonated.

This is where I turn to metrics like Time on Page and Scroll Depth. When I see a high Time on Page combined with a low Bounce Rate, it’s a classic sign of a pillar piece of content that's hitting the mark. It’s a strong signal that visitors found what they needed and are genuinely engaged.
But here’s a crucial piece of advice: context is everything. A high bounce rate isn't automatically a failure. If someone lands on your "how-to" post, gets their answer in 30 seconds, and leaves, that’s a win. Your content did its job perfectly. You have to look at these metrics together to understand the why behind the numbers.
Uncovering the Story Behind the Clicks
To really see what’s working, you have to dig deeper than what standard analytics dashboards show you on the surface.
Heatmaps are one of my go-to tools for this. They're incredible for visualizing user behavior—showing you exactly where people click, linger with their mouse, and how far down the page they actually scroll. You might be surprised to find that a small section you barely thought about is what’s capturing the most attention.
Understanding how your audience feels about your content is just as important as the raw data. This is why I always recommend actively gathering valuable customer feedback to get direct input on what's working and what isn't.
It’s also smart to look at comments versus social shares. A flurry of shares shows broad appeal, which is great. But a handful of thoughtful, detailed comments often signals a much deeper connection with your message. It’s a trend across the industry—in fact, 53% of marketers now see tracking engagement as a top priority for measuring performance.
This same logic applies across different formats. For video, view count is almost meaningless on its own. Diving into your https://timeskip.io/blog/youtube-video-analytics will show you the real story through audience retention charts and drop-off points. By piecing together all these different signals—both the hard numbers and the human behavior—you get a complete picture of what your audience truly values.
Connecting Content to Leads and Conversions
While likes and shares are great for the ego, what really moves the needle is turning those readers into actual customers. The ultimate goal is to draw a straight line from a piece of content directly to a business outcome, whether that's a newsletter signup, an ebook download, or a demo request.
But here's where it gets tricky. The customer journey is rarely that simple. A potential customer might read three of your blog posts and watch a webinar over a couple of weeks before finally deciding to book a call. So, which piece of content gets the credit? That’s the million-dollar question that attribution modeling tries to answer.
This initial process gives you a starting point for thinking about how to connect the dots from basic traffic to real business impact.
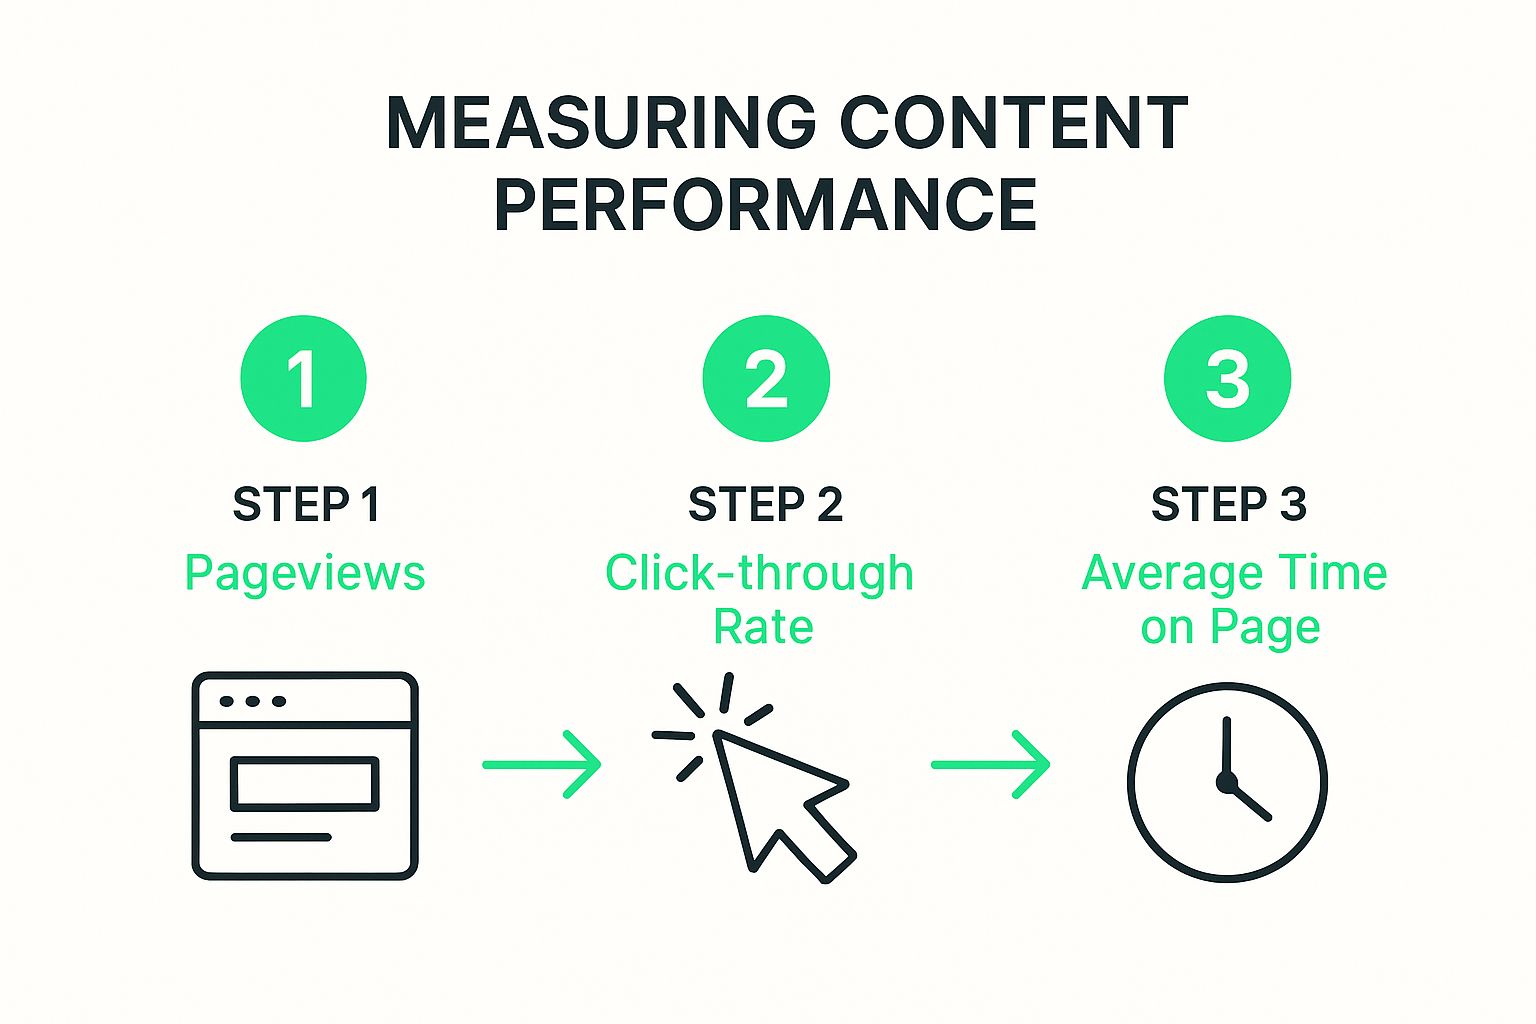
As you can see, you start with foundational metrics like pageviews and time on page, which then build up to the more valuable conversion data.
Understanding Content Attribution
Attribution is just a fancy way of saying you’re giving credit where credit is due. It helps you figure out which marketing touchpoints convinced someone to convert. There's no one-size-fits-all model; the best one for you really depends on how long your sales cycle is and what you're trying to achieve.
Here are the most common models I've seen in action:
- First-Touch Attribution: This one gives 100% of the credit to the very first piece of content a user ever saw. It’s perfect for figuring out what content is best at grabbing initial attention and bringing new people into your world.
- Last-Touch Attribution: The polar opposite. This model gives all the credit to the final touchpoint right before the conversion. This helps you identify your "closers"—the content that seals the deal.
- Multi-Touch Attribution: This is where things get really interesting. Instead of an all-or-nothing approach, this model spreads the credit across several touchpoints. It recognizes that, most of the time, a conversion is the result of a relationship built over time.
To truly gauge your content's effectiveness in driving business growth, it's crucial to delve into mastering key lead generation KPIs that directly reflect sales potential.
Picking the right model gives you a much clearer picture of your content’s true role. It helps you see the entire funnel, not just a single snapshot, allowing you to focus on what drives real, measurable results for the business.
Calculating Your Content Marketing ROI
This is where your strategy gets real. Calculating your content marketing Return on Investment (ROI) is how you translate all those blog posts, videos, and downloads into a language the C-suite understands: dollars and cents. It’s what separates a "nice-to-have" content team from a strategic, revenue-driving force.

On the surface, the formula seems simple: (Return from Content - Cost of Content) / Cost of Content. This gives you a percentage showing how much you earned for every dollar you spent. The real challenge, however, isn't the math itself. It's in accurately tracking everything that goes into those two variables.
Breaking Down the ROI Formula
Getting a reliable ROI figure means you have to be meticulous about tracking both what you spend and what you earn. This requires a sharp eye on your expenses and a solid system for connecting revenue back to specific content pieces.
Calculating Your Content Costs
Don’t just count the invoice from your freelance writer. A true cost analysis digs much deeper.
- Team Time: The salaries of your in-house team members for the time they spend on content strategy, creation, and distribution.
- Tools & Tech: The subscription costs for your SEO platforms, analytics software, design tools, and project management systems.
- External Talent: Any money spent on freelance writers, designers, video producers, or agency partners.
- Promotion Budget: The costs for paid social ads, search ads, or influencer campaigns you use to get more eyes on your content.
Connecting Revenue to Content
This part can feel tricky, but with the right setup, it's completely achievable. The key is using your analytics and CRM to follow the customer journey. Did a new customer first find you through a specific blog post? You can track that. For an e-commerce brand, you can see exactly how many sales came directly from a "shop now" link in a how-to guide.
Expert Take: Don't get stuck only on the hard numbers. Part of your job is to explain the value of "softer" ROI metrics, like a noticeable improvement in lead quality or the long-term value of customers you acquire through content. A lead who converts after reading a detailed, technical whitepaper is often far more valuable than one who clicked on a simple listicle.
To get a complete picture of your content's financial impact, you need to explore proven strategies to improve marketing ROI. When you master this calculation, you'll have all the data you need to defend your budget, prove your team's value, and get the green light for your next big idea.
Common Questions About Measuring Content
Once you get the hang of the tools and metrics, you'll naturally start asking deeper questions. That's a great sign. It shows you're shifting from just collecting data to thinking strategically about what those numbers are actually telling you.
Let’s walk through some of the most common hurdles I see marketers run into when they first start digging into their content's performance.
How Often Should I Be Reporting on This?
One of the first questions people ask is about reporting frequency. While there's no magic number, a good rhythm to fall into is monthly and quarterly.
Monthly check-ins are perfect for spotting operational trends—things like traffic dips or lead flow changes that need a quick reaction. The quarterly reviews are for zooming out to see the bigger picture. This is where you'll analyze things like overall ROI and the health of your entire marketing funnel. That said, if I'm launching a big campaign, I’m definitely peeking at the data weekly for the first month to make sure we can pivot fast if needed.
Another common point of confusion is benchmarks. Everyone wants to know what a "good" bounce rate is, but chasing a universal number is usually a waste of time.
Your most important benchmark is your own past performance. A blog post will almost always have a higher bounce rate than a product page, and that's perfectly fine. The real goal is to consistently improve upon your own averages.
Why Is My Content Getting Traffic But No Conversions?
Ah, the classic (and incredibly frustrating) problem. The first thing I check is the traffic's intent. Are you pulling in people who are just becoming aware of their problem when your page is built to sell a solution? If you're sure the audience is a good fit, the problem is almost certainly on the page itself.
Here's what you should dig into next:
- Clarity: Is your call-to-action (CTA) crystal clear, relevant to the page, and genuinely compelling? Is it buried at the bottom?
- Expectation Mismatch: Does your headline make a promise that the content doesn't actually fulfill? Clickbait might get the visit, but it won't get the conversion.
- User Experience: Use a heatmap tool. See exactly where people's attention drops off and what crucial elements—like your CTA button—they're completely ignoring.
From there, you can start A/B testing different CTAs, button colors, and copy to figure out what finally gets your audience to take that next step. For a much deeper look at this process, check out our complete guide on how to track content performance.
How Do I Handle Really Old Content?
Don't forget about your archives—they can be a goldmine. For older posts, the main thing to look for is content decay. This is when you see key metrics, like organic traffic or keyword rankings, slowly but surely slipping month after month.
This data is your roadmap for finding the best candidates for a "content refresh." Honestly, updating an old post with fresh information, better visuals, and stronger CTAs is one of the highest-ROI activities in content marketing. You're improving an asset that Google already sees as an authority.
Ready to stop guessing and start growing? TimeSkip helps you optimize your YouTube videos in seconds. Generate SEO-friendly chapters with a single click to boost your visibility and keep viewers watching longer. Get your first two videos free and see the difference for yourself at https://timeskip.io.
