Think of YouTube Analytics as the story your viewers are telling you with their clicks and watch time. It's not just a boring spreadsheet; it's a direct line to understanding what really grabs their attention and what makes them stick around. Getting comfortable with this tool is how you stop guessing and start creating content that consistently hits the mark.
Why YouTube Analytics Is Your Secret Weapon
So many creators get stuck in a cycle of just uploading what they think will work. While your creative gut is a huge part of the equation, data is what turns a passion project into a channel that actually grows. When you start analyzing your video performance, you don't have to wonder what your audience wants anymore—they're already telling you.
Your analytics dashboard is basically your mission control. It paints a surprisingly clear picture of your audience and how they behave. You'll quickly move beyond just knowing how many people watched and start discovering who they are, what kept them hooked, and how they even found you in the first place. This feedback loop is your single most powerful tool for building a dedicated community.
Understanding Viewer Behavior at Scale
The sheer size of YouTube's audience makes this data incredibly powerful. People watch over 1 billion hours of video on the platform every single day, and the average person's viewing session clocks in at about 30 minutes. With over 500 hours of new content flooding the site every minute, you need an edge to stand out. It's also worth noting that 70% of all that watch time happens on mobile, which is a huge signal for how you should be creating your videos. If you're curious, you can explore more about these viewership trends and what they mean for your strategy.
Analytics turns vague questions into concrete actions. You stop asking, "What should I make next?" and start saying, "My audience clearly loved this format. I'm going to make more of it."
Answering Your Most Critical Questions
At the end of the day, analytics gives you solid answers to the questions that keep every creator up at night. By digging into the numbers, you can find out:
- Who is actually watching? Get a breakdown of your audience's age, gender, and where they live so you can speak their language.
- What holds their attention? See the exact moments in your videos that made people lean in, and just as importantly, the moments that made them click away.
- How are they finding me? Discover if viewers are discovering you through YouTube Search, seeing you in their Suggested Videos, or clicking over from other websites.
This is the kind of information that lets you move from just throwing videos at the wall to see what sticks, to building a real, calculated plan for a channel that people love.
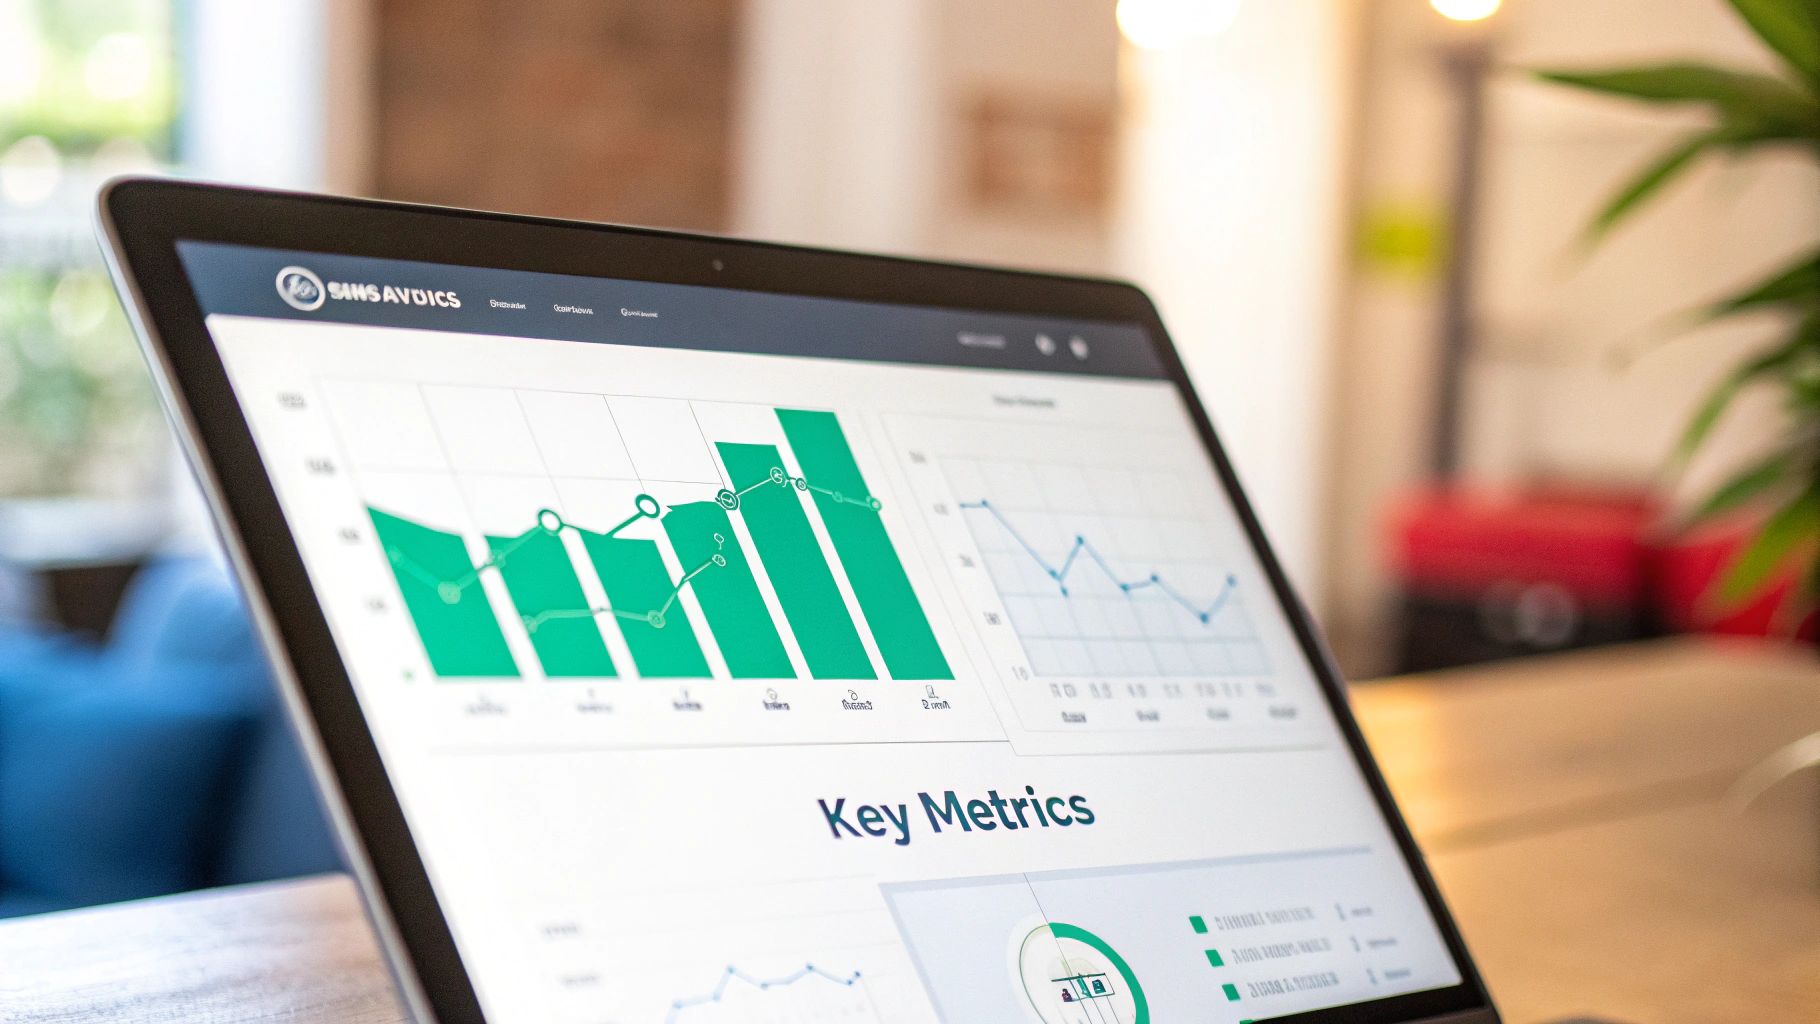
How to Navigate the Analytics Dashboard
Jumping into the YouTube Analytics dashboard for the first time can feel a little overwhelming. It’s like stepping into the cockpit of an airplane, with dials, graphs, and numbers everywhere. But don't worry, once you get the lay of the land, you'll find it's a powerful and intuitive tool designed to give you clear insights.
Think of it as your roadmap to channel growth. Everything is neatly organized under four main tabs, each built to answer a fundamental question about your content. This setup makes it easy to find exactly what you're looking for, whether you're doing a quick performance check or a deep dive into viewer behavior.
Your Primary Control Panel: The Four Main Tabs
The dashboard is designed to walk you through your data logically. Each tab represents a different piece of the puzzle, from how people discover your videos to what keeps them coming back for more. Getting comfortable with these four sections is the first real step to understanding the story your data is telling.
Let's do a quick tour of your command center:
- Overview: This is your 30,000-foot view. It gives you a quick snapshot of your channel's vital signs—views, watch time, and subscriber growth—over a specific time frame. It’s perfect for a daily check-in.
- Reach: This tab answers the crucial question, "How are people actually finding my videos?" It breaks down your traffic sources and shows how many people saw your thumbnails (Impressions) versus how many actually clicked to watch (Click-Through Rate).
- Engagement: So, they clicked. Now what? This is where you find out if they stuck around. The Engagement tab measures how well your content holds attention using metrics like Watch Time and Average View Duration.
- Audience: Who is your audience? This tab paints a picture of the people watching your videos, showing you demographics like age, gender, and top geographies.
This is the main screen you’ll land on, giving you a snapshot of your channel’s performance over the last 28 days.
From here, you can spot your top videos at a glance, check on recent trends, and even see what’s happening on your channel in real-time.
Using The Overview Tab For Quick Insights
The Overview tab is your home base. It’s designed to give you a fast, digestible report on your channel's health without drowning you in data. The first thing you'll see is a big, bold graph showing your views, but you can easily toggle it to show watch time or subscriber changes instead.
Just below the main graph, you'll find cards highlighting your top-performing videos for the period and real-time stats showing activity from the last 48 hours.
The Overview tab isn't for deep, complex analysis. It’s for taking your channel’s pulse. A sudden spike or an unexpected dip here is your cue to dig into the other tabs and figure out why it happened.
By starting your analysis here, you can spot important trends as they happen. If a new video is blowing up and getting way more views than usual, you’ll see it here first. This allows you to react, understand what's resonating with your audience, and fold those lessons into your next video.
Understanding Core Audience Engagement Metrics
If views tell you how many people showed up, engagement metrics tell you the real story: how many people actually stayed for the show. These numbers are the pulse of your channel. They're what tell the YouTube algorithm that your content isn't just getting clicked on—it's genuinely connecting with people.
Think of it like this: you’re a stand-up comedian. Views are the number of people in the seats. But engagement? That’s the laughter, the applause, and the people telling their friends about your set afterward. That’s what really matters.
Decoding Watch Time and Audience Retention
Let's get right to the heart of it. The two most critical metrics here are Watch Time and Audience Retention.
Watch Time is exactly what it sounds like: the total number of minutes viewers have spent watching your content. It's a huge signal to YouTube. The longer your videos keep people on the platform, the more the algorithm sees your channel as valuable.
But Audience Retention is where the magic happens. This isn't just a number; it's a graph that shows you the percentage of your audience that is still watching at every single second of your video. This is your secret weapon for making better content. It lets you see the exact moments you nailed it and, more importantly, the moments where viewers decided to click away.
For a really detailed breakdown of these concepts, our guide on YouTube video analytics is a great next step.
When you look at your retention graph, you're essentially looking for clues:
- The Hook: Did your intro hold strong? A good goal is to keep over 70% of viewers watching past the first 30 seconds.
- The Spikes: See any little bumps in the graph? Those are moments where people re-watched a section. That’s pure gold—figure out what you did there and do more of it.
- The Dips: Where did people leave in droves? Was it a boring segment? A confusing explanation? An ad break? These are your biggest opportunities to improve.
The image below shows another piece of the puzzle you'll find in your analytics: who your audience is.
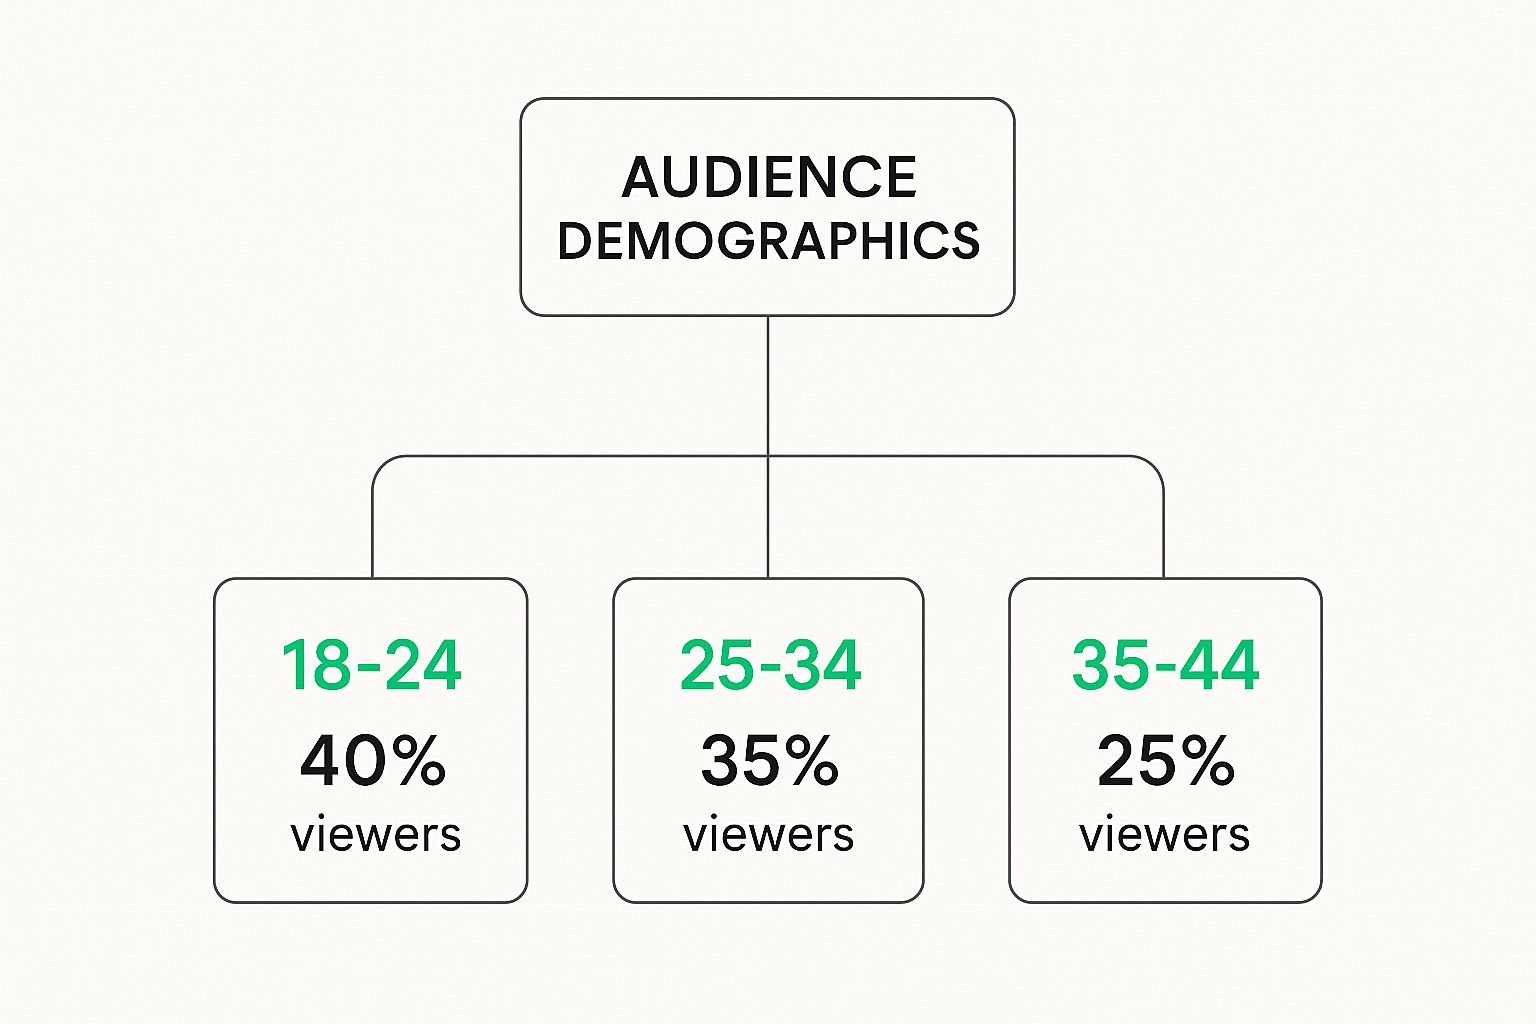
Knowing, for example, that your main audience is in the 18-34 age range can completely change how you script, shoot, and edit your videos.
To help you keep these straight, here’s a quick breakdown of the most important engagement metrics and what they actually mean for your channel.
Key Engagement Metrics and What They Mean
| Metric | What It Measures | Why It's Important |
|---|---|---|
| Watch Time | The total minutes viewers spent watching your video. | A core ranking factor. Higher watch time tells YouTube your video is good at keeping users on the platform. |
| Audience Retention | The percentage of viewers still watching at any given point in your video. | Your best diagnostic tool for identifying engaging parts (spikes) and boring parts (dips) of your video. |
| Likes | The number of viewers who clicked the "like" button. | A direct signal of positive sentiment. It tells the algorithm that your content is well-received. |
| Comments | The number of comments left on your video. | Shows your content is sparking conversation and building a community, a very strong positive signal. |
| Shares | The number of times viewers shared your video on other platforms. | The ultimate endorsement. A share means someone is vouching for your content to their own network. |
Ultimately, each of these metrics paints part of a larger picture, showing you not just if people are watching, but how they are interacting with your work.
The Social Signals: Likes, Comments, and Shares
While Watch Time is about keeping viewers glued to the screen, social metrics like Likes, Comments, and Shares show you how healthy your community is. These aren't passive views; they're active signals that your content made someone feel something.
A high number of likes and a bustling comment section tell YouTube your video is striking a chord. It's generating discussion, agreement, or even a healthy debate. It’s valuable enough for people to stop and take action.
Shares are on another level entirely. Think about it: when someone shares your video, they are putting their own reputation on the line to recommend it. It's a personal endorsement, and that's one of the most powerful signals you can possibly send to the algorithm.
Decoding How Viewers Discover Your Videos
So you've poured your heart and soul into creating a fantastic video. That's the first half of the battle. The other half? Figuring out how people actually find it. This is precisely where the "Reach" tab in your YouTube Analytics becomes your most trusted guide.
Think of it this way: your video is a new coffee shop you just opened. The Reach tab tells you how customers are walking through your door. Are they finding you because of a huge billboard on the highway (Browse Features)? Did a trusted friend recommend your latte (Suggested Videos)? Or did they specifically search on Google Maps for "best coffee near me" (YouTube Search)? Each path reveals something crucial about how your content is positioned and perceived.
The Most Important Discovery Channels
While viewers can stumble upon your videos in countless ways, most of your traffic will likely come from a handful of key sources. Getting a grip on these is fundamental to real growth.
-
YouTube Search: This is straightforward. Someone typed words into the YouTube search bar, and your video popped up. High traffic from search means you've done a great job aligning your video's topic and keywords with what people are actively looking for.
-
Suggested Videos: Your video appeared in the "Up Next" sidebar or after another video finished playing. This is a golden ticket from the algorithm, signaling that YouTube sees your content as a perfect chaser to what someone is already watching, keeping them engaged on the platform.
-
Browse Features: This is traffic from the YouTube homepage, the subscription feed, and other discovery spots like the "Explore" tab. Performing well here means your thumbnails and titles are compelling enough to stop scrollers in their tracks—both loyal subscribers and potential new fans.
Thinking about how people find you via YouTube Search is really just a specific form of Search Engine Optimization. If you want a broader look at the topic, you can start by demystifying SEO for business owners, as many of the core principles apply directly to optimizing your videos.
Key Insight: The algorithm that powers Suggested Videos and Browse Features is an absolute powerhouse. It's responsible for a staggering 70% of all the time people spend watching videos on the platform. This stat alone shows why creating content that plays well with the recommendation engine is non-negotiable for growth.
The Power Couple: Impressions and Click-Through Rate
Inside the Reach tab, two metrics work hand-in-hand to tell you a complete story: Impressions and Click-Through Rate (CTR).
First, an impression. This is counted every single time YouTube displays your video's thumbnail to a user on the platform. It's a chance, an opportunity, for someone to click.
Then you have your CTR, which is simply the percentage of those impressions that convinced someone to actually click and watch your video.
I like to think of your thumbnail and title as a movie poster. Impressions are the number of people who walked past that poster in the theater lobby. The CTR is the percentage of those people who looked at the poster and thought, "I have to see that movie."
A high number of impressions but a low CTR is a classic sign. It tells you YouTube is showing your video to people, but your "poster" isn't grabbing their attention. Maybe the thumbnail is blurry, or the title isn't intriguing enough. By looking at these two metrics together, you can diagnose whether your problem is visibility (not enough impressions) or appeal (low CTR), and start making smart, targeted changes to fix it.
Getting to Know Your Audience Demographics

Trying to create content without knowing who you're talking to is like telling a story in an empty room. You’re just shouting into the void, hoping someone connects. The 'Audience' tab in your YouTube Analytics is where you finally get to see who's on the other side of the screen, turning those abstract view counts into real people.
This is where you stop guessing and start making informed decisions. Once you understand the age, gender, and geographic location of your viewers, you can fine-tune everything. Your video topics, the language you use, even the pop culture references you make—it all becomes clearer. This is a crucial step toward building a real community, not just a subscriber list.
Who Is Watching Your Videos?
The core demographic reports are your first stop. Right away, you’ll see a breakdown of who actually makes up your audience. Knowing your content resonates primarily with men aged 25-34 will guide your communication style very differently than if you were speaking to women aged 18-24.
These insights are pure gold. For instance, if you find a large chunk of your audience is from a country where English is a second language, you might start adding translated subtitles or simply make a point to speak more clearly. When you combine this kind of demographic data with other key YouTube channel metrics, you start building a more thoughtful and accessible channel.
Remember, YouTube is a global giant with over 2.7 billion monthly active users. India leads the pack with 491 million users, and the largest age group worldwide is 25 to 34—a prime demographic you might already be reaching.
When to Post for Maximum Impact
One of the most practical tools in the entire Audience tab is the "When your viewers are on YouTube" report. It’s a simple bar chart that shows the exact days and hours your audience is most active on the platform. Think of it as your channel's personal primetime TV slot.
Pro Tip: Schedule your videos to go live just before these peak times. Giving your upload a strong initial push in those first few hours can dramatically improve its performance with the algorithm over the crucial first 48 hours.
Uncovering Content and Collaboration Opportunities
Don't sleep on the "Other channels your audience watches" report. This isn't just a list of your "competition"—it’s a goldmine for understanding your audience's broader interests and planning your next move.
Use this report to:
- Brainstorm video ideas: See what topics are working well for creators your audience already trusts.
- Find collaborators: A partnership with a channel your viewers already love is a natural win-win.
- Refine your style: Pay attention to the formats and editing techniques that are clearly resonating with your shared audience.
Turning Your Analytics Into a Real Growth Strategy
Let's be honest: data is just a pile of numbers until you do something with it. The real magic of YouTube analytics happens when you use those numbers to make smarter decisions. This is the moment you stop just looking at data and start using it to build a real plan for growth.
Think of yourself as a detective. Your analytics dashboard is the crime scene, full of clues. You might find high audience retention on a specific video, a surprise spike in traffic from a new search term, or a whole new audience popping up in another country. Your job is to connect those dots and figure out what your viewers are telling you. This is how you build a repeatable system for making better videos.
From Numbers to Your Next Big Idea
The goal here is to create a feedback loop. Every video you publish should teach you something that makes your next video even better. Instead of guessing what your audience wants to see, you're letting their actions—their clicks, their watch time, their shares—be your guide. You're trading uncertainty for a clear roadmap based on actual performance.
Here are a few ways this plays out in the real world:
-
You See a High-Retention Winner: Let's say your video on "beginner-friendly sourdough" has an incredible 80% audience retention. That's not just a good stat; it's a massive green light from your viewers. They're screaming, "More of this, please!" Your next video could easily be "5 Common Sourdough Mistakes" or a deeper tutorial on "Choosing the Right Starter."
-
You Discover a Traffic Goldmine: You're looking at your traffic sources and notice that "YouTube Search" is driving 40% of the views to your video on camera settings. That's your cue to double down. Start planning a whole series around specific search terms like "best budget vlogging camera" or "how to get blurry backgrounds in video."
-
You Find a New Audience: Suddenly, your analytics show a growing viewership from a new country. This is a huge opportunity. YouTube's global ad reach is staggering, hitting about 2.53 billion people, with markets like India's 491 million viewers being massive. If you see a spike there, why not add translated subtitles or create content that resonates with cultural interests in that region? You can dive into more of these global YouTube statistics to find even more hidden opportunities.
Your Monthly Analytics Check-In
To keep this from becoming overwhelming, build a simple monthly habit. Just set aside 30 minutes, open your analytics, and look for the bigger picture. Your mission is to answer these four questions:
What actually worked this month? Pinpoint your top 3 videos based on watch time and views. What do they have in common? Was it the topic? The format? The thumbnail style?
What fell flat? Be just as curious about your worst-performing videos. Where did people click away? Was the topic too niche, or did the intro fail to hook them?
Who is watching my videos right now? Take a peek at your demographics. Has your audience changed? Are you reaching the people you thought you were?
Where are my viewers coming from? Check your traffic sources. Is YouTube Search picking up steam? Are Suggested Videos still your biggest driver?
When you turn the answers to these questions into your to-do list for next month, you start building real momentum. This systematic process is at the heart of our complete guide on how YouTube analytics is explained, designed to help you build a channel that grows consistently over time.
Frequently Asked Questions About YouTube Analytics

Even after you get the hang of the dashboard, some questions always seem to come up. Nailing down the answers to these common sticking points is what separates creators who just look at their data from those who use it to actually grow their channel.
Let's dive into a few of the most frequent questions I hear from other creators.
How Often Should I Check My Analytics?
There’s no magic number here, but finding a good rhythm is everything. When you drop a new video, you’ll want to keep a close eye on it for the first 48-72 hours. This is a super important window where the algorithm is figuring out who to show your video to.
After that initial buzz, a weekly check-in is usually enough to spot any developing trends without driving yourself crazy.
Then, set aside time once a month for a much deeper dive. This is when you can look at the big picture, analyze broader patterns, and make smart decisions for your upcoming content schedule.
Which Is More Important: CTR or Audience Retention?
Ah, the classic debate! The truth is, it’s not an "either/or" situation—they’re a dynamic duo. Click-Through Rate (CTR) is what gets people to click play, while Audience Retention is what keeps them watching. You absolutely need both for a video to take off.
Think of it like a movie. A killer trailer (high CTR) might get everyone into the theater, but if the movie itself is a snooze-fest (low retention), people will walk out, and it'll flop. The YouTube algorithm wants the whole package: videos that both grab attention and hold it.
Can You See Another Channel's Analytics?
The short answer is no; you can't peek behind the curtain at another channel's detailed stats. But there's a fantastic workaround.
Head over to your "Audience" tab and look for the "Other channels your audience watches" module. This is an absolute goldmine for content ideas and for scouting potential creators to collaborate with.
What Are YouTube Shorts, and Are They Important?
They are incredibly important! YouTube is pouring a ton of energy into its short-form content. With YouTube Shorts now pulling in over 50 billion daily views, it's clear there's a massive audience for quick, snappy videos. If you're not experimenting with Shorts, you're likely leaving a ton of potential growth on the table. You can explore more YouTube statistics to see just how big the opportunity is.
What Does "External" Traffic Mean?
It's simpler than it sounds. "External" just refers to any viewer who found your video from a source outside of YouTube itself.
This could be from:
- A link you shared on Twitter or Facebook
- An embedded video on a blog post
- Someone finding your video through a Google search
Tracking this helps you understand where your videos are getting shared and which promotional efforts are actually paying off.
Ready to stop manually scrubbing through videos to find the perfect chapter timestamps? With TimeSkip, you can generate SEO-optimized chapters in seconds. Let our AI do the heavy lifting so you can focus on creating amazing content. Get started for free at https://timeskip.io.
